Wednesday’s trade setup exhibited a choppy movement throughout the day.
This followed the Doji candle formation that we analyzed in the previous blog, which appeared on the daily timeframe. As we discussed, a breakout on either side of the Doji—upward or downward—can signal a trend-following or trend-reversing move.
However, despite the choppy price action for most of Wednesday, the market eventually closed with a decline of around 136.70 points. So overall, the market did show a downside movement, even though the day was marked by indecisiveness.
Global market analysis
Trump’s Tariff Pause Sparks Mixed Reactions
After announcing Liberation Day reciprocal tariffs globally yesterday Trump declared a 90-day pause on reciprocal tariffs for 75 countries. These tariffs were originally imposed due to what the U.S. administration described as unfair trade practices. Trump stated that negotiations would take place in the near term, and based on their outcome, the situation would be reviewed for further actions.
This unexpected move created some volatility in the markets, with both the S&P 500 and NASDAQ reacting modestly positively. However, a notable development followed—Trump posted on his social media platform that “this is the best time to buy Wall Street.” This post has sparked controversy, with opposition leaders accusing him of potential insider trading. They allege that Trump’s post may have been an indirect signal to investors ahead of the official announcement about the tariff pause.
As a result, the situation has turned controversial, and it remains to be seen how these allegations and market responses will unfold in the coming days.
Nasdaq up
In Wednesday’s session, the NASDAQ surged nearly 12%—a massive rise not seen since 2008—driven by the announcement of the tariff pause.
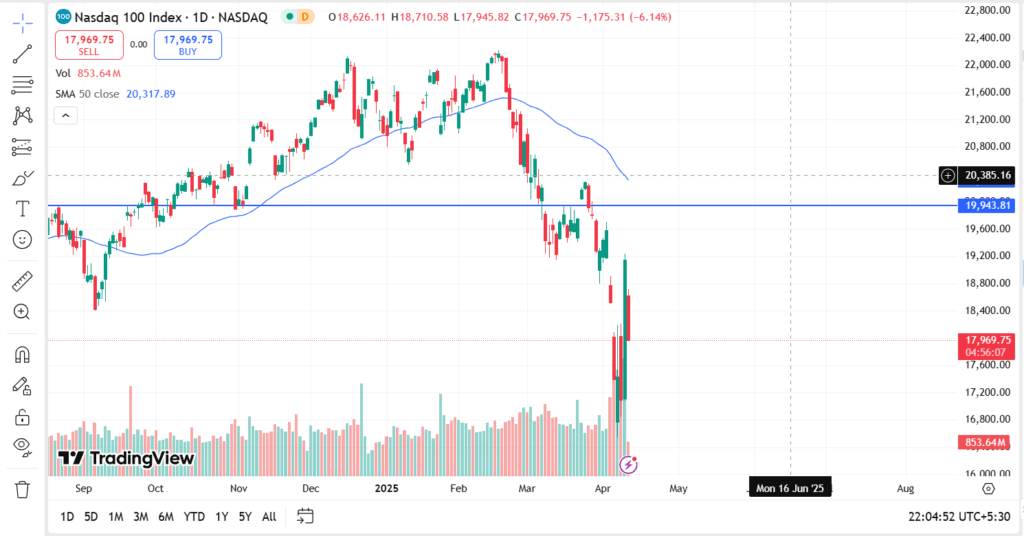
This development has provided short-term relief to businesses and boosted investor sentiment. The 90-day pause offers a window of opportunity for the U.S. and its trade partners to negotiate fairer trade deals, which is seen as a positive sign for the global economy.
However, this doesn’t mean speculation around tariffs has ended. The true outcome will unfold over time, as it depends on how the U.S. negotiates and finalizes trade agreements with each of the 75 countries involved.
U.S. CPI Data Update
The U.S. has released its month-on-month Consumer Price Index (CPI) data, which came in at 2.4%, lower than the previous figure of 2.8%. The market had been forecasting a reading of around 2.5%, so the actual data beat expectations by coming in slightly lower.
This is a positive sign for the economy, as lower inflation can ease pressure on interest rates and support various sectors. Additionally, the recent pause in tariffs may contribute to further improvement in inflation data in the coming months.
Domestic market analysis
90-Day Tariff Pause Fails for China; India Emerges as a Potential Beneficiary
The 90-day pause in the tariff war has not been successful for China, as former President Trump has now announced an additional 20% tariff on Chinese imports—bringing the total tariffs to nearly 125% on a wide range of Chinese goods. This move has reignited trade tensions and is raising serious concerns for both the U.S. and China.
However, this escalation could prove to be a significant opportunity for India. Many U.S. companies rely on Chinese manufacturing, and with these heavy tariffs in place, they may start looking for alternative destinations. India stands out as a strong candidate due to its cost-effective manufacturing environment.
While Vietnam is also a major manufacturing hub, it faces its own risks, including a large trade surplus with the U.S., which could make it vulnerable to similar tariff actions in the future. India, in contrast, has a more balanced trade relationship and could emerge as a key beneficiary of the shifting global supply chains.
If these trends continue, India may see increased foreign investment and a rise in its role as a global manufacturing hub. The coming months will be crucial in observing how this situation unfolds and what long-term impacts it brings to global trade dynamics.
Global and Asian Markets Rally; Gift nifty Follows Suit
Following strong cues from global and Asian markets, the gift nifty index is also showing positive momentum, rising by approximately 2.32%—a gain of nearly 50 points in the near term.
This suggests that the market is likely to open with a significant gap-up, reflecting strength in response to the broader global rally.
Commodity market analysis- crude oil and gold
Commodity market analysis Commodity researches like gold and crude is making a so-so attraction of commodity tariffs as gold is making an all-time new high after the uncertainty happened with the tariffs, so it is making nearly 92,000 levels in the first time in the history.
Also, crude is making positive things for India’s fiscal deficit as it has made nearly 17% down in the last 7-8 trading sessions, so it has made a clear way to control the inflation of India and making a trade surplus following the crude prices.
Commodities like gold and crude oil are drawing mixed attention amid ongoing tariff uncertainties. Gold has reached a new all-time high, crossing the ₹92,000 mark for the first time in history, driven by global uncertainty and safe-haven demand.
On the other hand, crude oil has shown a sharp decline of nearly 17% over the past 7–8 trading sessions. This is a positive development for India, as falling crude prices help reduce the fiscal deficit, ease inflationary pressures, and support a better trade balance.
These trends indicate a diverging path in commodities, with gold gaining due to uncertainty and crude offering macroeconomic relief for oil-importing countries like India.
FII&DII activity analysis
FII Selling Continues to Pressure Indian Markets
Foreign Institutional Investors (FIIs) continued their selling spree in Wednesday’s trade, offloading nearly ₹4,358.02 crore in Indian equities and around ₹2,976.66 crore in the cash market.
This marks a continuation of the selling trend observed in April. So far this month, FIIs have sold approximately ₹32,122.76 crore, making them significant net sellers in the Indian market.

This persistent outflow has added pressure on market sentiment and is one of the key reasons behind the recent downward movement in equities.
Option chain analysis
As we move into the new contract cycle with only three trading days in the current week, Nifty’s next-week contract is witnessing lower volumes. Interestingly, we’re also seeing notable activity in in-the-money option selling.
A closer look reveals that the 22,500 strike is shaping up as a key level. On the call side, we’re seeing 40,676 contracts written, indicating strong resistance. Surprisingly, the same level is also witnessing significant put writing—38,105 contracts—suggesting bullish sentiment as well.
Additionally, stronger support is visible at the 22,400 level, where 38,757 put contracts have been written. This put-heavy positioning indicates that option writers are leaning bullish, expecting the market to hold these levels or move higher in the coming sessions.
All eyes will be on Friday’s trade setup, as the market direction around these crucial levels—particularly 22,500—could decide whether bulls or bears emerge as the net winner.
Nifty 50 prediction
Following the Doji candle observed in yesterday’s trade setup, the market witnessed a choppy session due to low volumes and lack of clear direction. Market participants seemed uncertain, waiting for cues from the U.S. markets to gain clarity.
However, as per the GPT index movement, it appears that the upper range of the Doji may break to the upside, and instead of acting as resistance, it could now act as support, especially with the market likely to open with a gap-up.

Interestingly, the GPT index has already shown an upside move of nearly 600 points, which indicates strong momentum. If we look at the Nifty chart, the 23,000 level is a critical point, coinciding with a key moving average. A daily close above 23,000 could open the path toward the 23,800 level, which is a major resistance and potential trend reversal zone.
This move could be further supported by positive global cues and any favorable developments in the India–U.S. trade deal, which would provide a strong tailwind to the market.
Overall, the technical setup for Nifty looks promising, and a sustained move above 23,000 could set the stage for a larger bullish breakout.
Conclusion
The ongoing uncertainty surrounding U.S. tariff policy is creating a highly speculative and volatile environment in the global markets. This sentiment has reflected in the GPT index, which is currently indicating a potential 600-point upside, and possibly more, depending on how traders react during Friday’s trade setup.
The recent imposition of 125% tariffs on Chinese goods by the U.S. is expected to drive major shifts in global manufacturing. As the U.S. aims to attract more companies to manufacture locally, countries like India stand to benefit indirectly as part of the shifting supply chain. This geopolitical shift offers India a secondary advantage as companies seeks alternatives to China.
On the technical front, 23,000 remains a key resistance level for Indian equities. A strong close above 23,000 would be a highly bullish signal, potentially paving the way for a rally towards the 23,800 level, which marks the next major resistance and a crucial trend reversal zone.
In summary, a decisive move and close above 23,000 could mark a significant turning point, setting the tone for a more optimistic phase in Indian markets.