What is Technical Analysis?
There are various ways to analyze stocks, but two primary methods have a deep impact. One of the most popular and influential approaches is technical analysis.
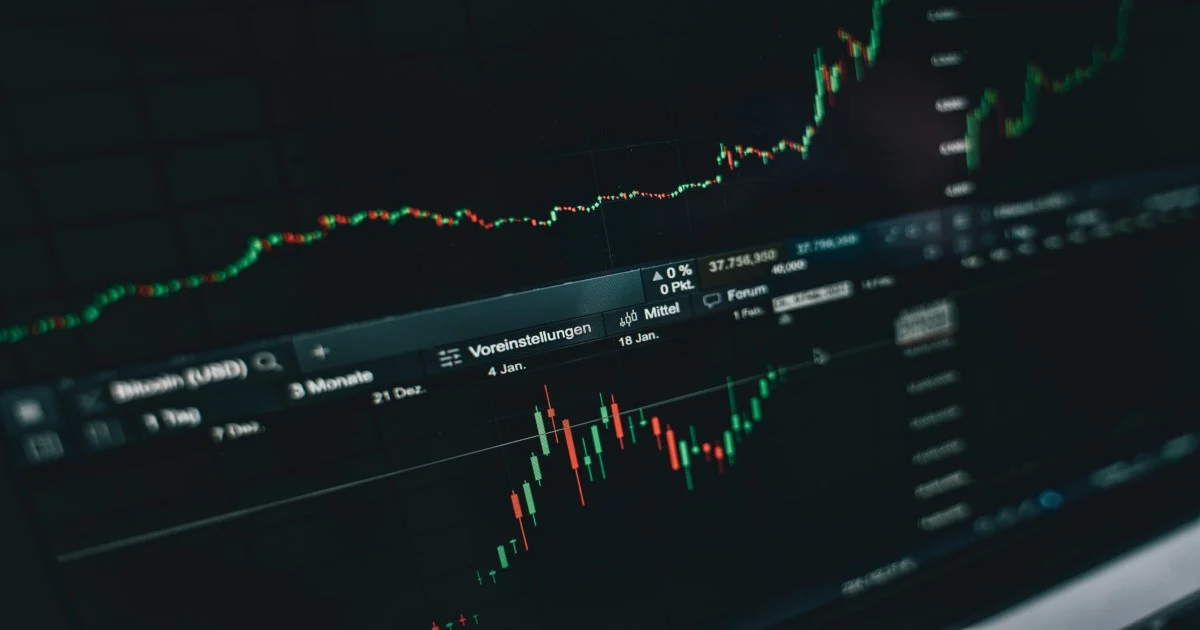
Technical analysis involves several key components, such as candlestick patterns, support and resistance levels, chart patterns, and trends. By using these tools, we analyze stock price movements. This form of analysis is called technical analysis.
Sometimes, traders rely solely on trends to assess price movement. However, incorporating additional factors like support and resistance levels or breakouts provides a more comprehensive analysis, increasing the probability of making accurate predictions about future stock prices. The higher the probability, the better the chances of success.
Many people believe that technical analysis is mainly used by speculators or traders. However, this is not entirely true. Investors, including long-term investors, also use technical analysis to gain better insights into stocks.
For example, an investor analyzing a stock chart may find that technical analysis is most effective for predicting short-term movements of 3-5%. However, if a stock moves 10-12% or more, the reason is often beyond technical factors. Such movements could be driven by quarterly earnings reports, market expectations, upcoming events, global economic factors, fundamental changes, contract wins, or other major news.fud
Importance of technical analysis
The importance of technical analysis increases as it helps you assess stocks and determine whether to be bullish or bearish. It also helps you set the right stop loss by providing a specific price at which you can place your stop loss or target. If your analysis proves correct, you can hold your position for the long term while securing your gains.
To protect your profits and avoid losing them, you can use a trailing stop loss, which can also be identified through various technical analysis techniques. Technical analysis provides proper planning for managing your positions effectively
Limitations of technical Analysis
One crucial aspect of technical analysis is that it is based on probability. Every trade involves a probability of success or failure.
For instance, if a trader bases a trade solely on a breakout pattern, the outcome is uncertain—there’s a chance of success, but also a possibility of failure.
However, when multiple indicators align—such as support and resistance levels, breakouts, and strong candlestick patterns—the probability of a successful trade increases. If all three signals indicate a bullish trend, there is a higher likelihood of success compared to relying on just one factor.
That said, probability is not the same as certainty. Even when multiple indicators suggest a favorable outcome, there is no guarantee that the trade will work as expected. Probability only increases the chances of success but does not confirm it.
Difference between technical and fundamental analysis
Fundamental analysis or other types of analysis require a lot of skills and time. For example, when analyzing fundamentally, you have to assess the company’s business model, the growth of its sector, how the company’s financials are performing, and its valuation. These things require skills to understand proper calculations, perspective, experience, etc.
Also read ; Company analysis; business model, management analysis, peers analysis, financial analysis
In comparison, technical analysis doesn’t require such extensive knowledge. You only need to understand the stock’s trend, candlestick patterns, reversals, breakouts, and chart patterns. By analyzing these factors collectively or individually, you can make decisions about a particular stock. It also takes significantly less time—while fundamental analysis may take 2 to 3 days, technical analysis is much quicker.
Another key point is that as a stock change, its fundamental analysis also changes. For example, if you analyze a stock in the steel sector, you will need a different fundamental analysis compared to analyzing a stock in the IT sector. This requires a lot of time and effort. However, with technical analysis, you don’t need to change your approach based on the sector.
For example, the same technical analysis used for a steel sector stock can be applied to an IT sector stock. There is no differentiation—the same patterns, skills, and concepts like chart trends and breakouts apply to all stocks. Even if the stock changes, there is no need to worry because the analysis remains the same.
That is why technical analysis is easier compared to fundamental analysis.
Conclusion
Technical analysis is a powerful tool for assessing stock price movements and making informed trading decisions. While it is often associated with short-term traders, long-term investors can also benefit from its insights. By analyzing trends, support and resistance levels, candlestick patterns, and breakouts, traders can improve their probability of success. However, it is important to remember that technical analysis is based on probabilities, not certainties.
Compared to fundamental analysis, technical analysis is quicker and easier to apply across different sectors without requiring in-depth knowledge of a company’s business model or financials. While both methods have their advantages, technical analysis provides a streamlined approach to stock evaluation, making it a valuable skill for traders and investors alike.
6 thoughts on “Technical analysis; Difference between technical and fundamental analysis”