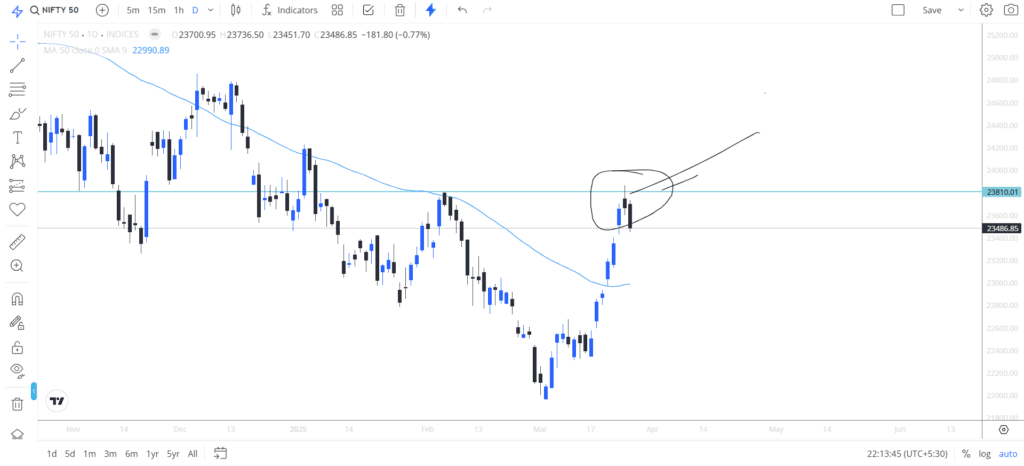
The 7-day winning streak of the Nifty 50 came to an end today, with the index closing nearly 180 points lower at 23,486. Over the past seven weeks, the market has shown a consistent uptrend, moving from 23,350 to approximately 23,850, gaining around 1,500 points.
However, today’s session witnessed profit booking near 23,850, leading to a decline and a close near 23,486. This marks a pause in the continuous upward movement observed in recent weeks also making tomorrow Trade setup challenging.
The market opened flat today and initially showed a slight upward movement. This was largely due to the Nifty 50 respecting the 15-minute 50-period moving average, which acted as a strong support level.
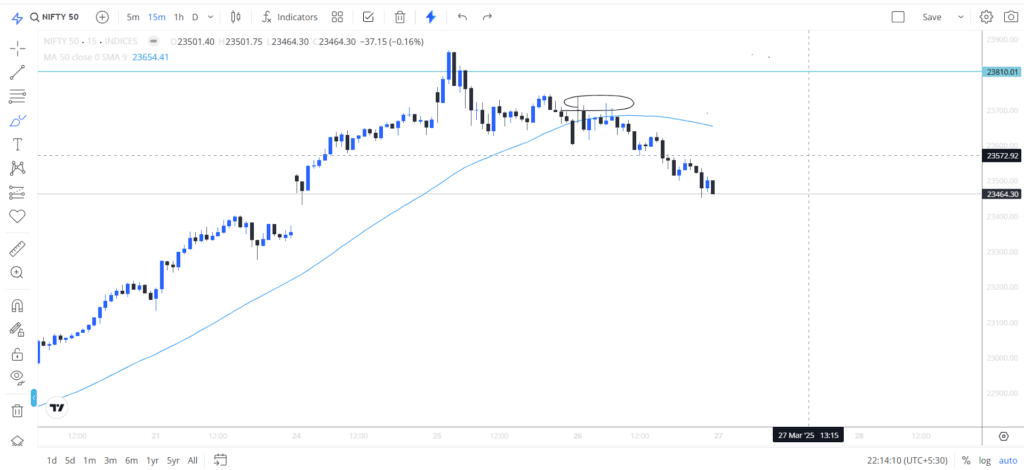
However, as the session progressed, the index faced resistance near the 50-day moving average. After a strong battle in morning the market struggled to hold above this level. Over the next seven 15-minute candles, the index eventually closed below the 50-day moving average.
Additionally, a hammer candlestick formed consecutively, signaling weakness in the index from higher levels. Following this pattern, the market experienced a continuous downside movement, indicating increased selling pressure.
Global market analysis
US GDP data
Tomorrow, the U.S. is set to release its GDP data, which is forecasted to be around 2.3%. This will be a key metric, especially as the Federal Reserve maintains a cautious policy stance. While the Fed has committed to two rate cuts in 2025, future decisions will likely depend on upcoming inflation data, particularly in April and May.
Additionally, April 2 is being referred to as “Liberation Day” by Donald Trump, as the U.S. plans to implement reciprocal tariffs on global trade. This could have significant implications for international markets, trade policies, and overall economic sentiment.
Yesterday, the U.S. announced a ceasefire agreement concerning the Black Sea, maritime activities, and Ukraine’s energy infrastructure. However, Russia stated that sanctions must be lifted before fully implementing the Ukraine-Maritime ceasefire. This reflects Russia’s usual approach, where it sets conditions before agreeing to any truce.
In addition, the U.S. has committed to assisting Russian food exporters in accessing global markets, signalling a potential shift in trade policies. The key aspect to watch is whether the U.S. and Ukraine agree to Russia’s demands, as ceasefire agreements in this conflict often come with preconditions.
Domestic Market Analysis for Trade setup
Russia- Ukraine black sea ceasefire
From an Indian perspective, this development could have significant economic implications. India imports crude oil from Russia at discounted rates, and any changes in sanctions or trade policies could affect pricing and supply. Additionally, India’s jewellery, defence, and other exports to Russia might be impacted, depending on how the geopolitical situation unfolds. It will be crucial to monitor how these negotiations shape global trade and energy markets in the coming weeks.
As April 2 approaches, market sentiment is increasingly focused on key geopolitical and trade developments. The Indian government has been engaged in long discussions regarding a Bilateral Trade Agreement (BTA) with the U.S., but no final decision has been reached yet.
Recently, Donald Trump stated that while the U.S. is hesitant to impose sanctions on certain countries, they feel obligated to do so. This suggests that the deal is still under negotiation and may take more time to finalize. April 2 should not be seen as a deadline but rather a milestone in ongoing discussions. Further talks between the U.S. and India are expected even beyond this date.
From a market perspective, traders and investors should keep an eye on any announcements related to the BTA, as it could impact sectors like IT, pharmaceuticals, and exports. Additionally, any trade-related shifts could influence rupee valuation, inflation, and broader market sentiment.
FII,DII Activity Analysis and Option Chain Analysis
FII,DII Activity Analysis
Today, Foreign Institutional Investors (FII) bought nearly ₹2,240 crore, while Domestic Institutional Investors (DII) sold around ₹696 crore, as per NSE data. Despite this, the market closed down by nearly 180 points, reflecting broader concerns and possible profit booking.
Looking at the March monthly trend, FIIs have been net sellers of ₹4,700 crore so far. With just two trading sessions left, they need to buy around ₹5,000 crore to turn net positive for the month.
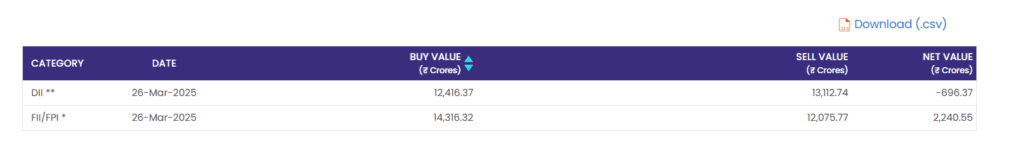
However, FIIs are not showing strong conviction amid the ongoing global trade uncertainties. While today’s buying reduces the gap, it remains to be seen whether the last two sessions will witness significant FII inflows to flip March into a net positive month.
This data will be crucial for gauging institutional sentiment as we head into April, especially with geopolitical tensions and upcoming economic events like the U.S. GDP data and trade discussions.
Option Chain Analysis
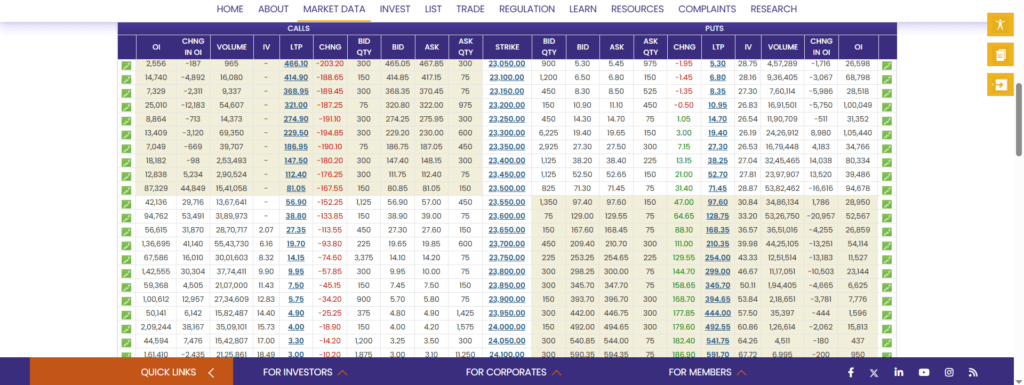
As discussed in our previous blog, 23800 has been gaining strength due to call writers building positions, making it a key resistance level. Similarly, 23500 was identified as a strong support level, but today, the market broke below 23500, closing near 23486, signaling potential weakness.
The latest option chain data reveals:
- 23800 saw a rise in open interest, now at 1,45,555 contracts, reinforcing its role as a resistance level.
- 24,000 has 2,09,244 contracts, making it one of the highest call-writing zones, indicating strong resistance.
- 23300 is emerging as a nearby support level with 1,05,440 contracts in open interest.
For the short term, we could see 23500 playing a pivotal role for tomorrow Trade setup
Market participants should closely watch these levels, as any significant breakout or breakdown could lead to strong momentum shifts.
Nifty 50 prediction
Today’s market action highlighted the significance of the 23800 level, which has been discussed multiple times as a trend-changing zone. The market faced resistance until 11 AM, after which selling pressure intensified, leading to a nearly 2,000-point decline, with a close near Tais 23486 near the day’s low.
Yesterday, Nifty formed a Doji candle on the daily timeframe, a classic reversal signal, indicating market indecision. This was followed by today’s strong bearish close, giving confidence to bearish traders.
Technical Patterns & Key Levels
- The last three-day candlestick structure has formed an Evening Star pattern, a strong bearish reversal indicator.
- With today’s close near the low, the short-term trend appears bearish, unless a significant recovery occurs.
- 23800 remains a key level, and if the market attempts a pullback, it may act as a strong resistance.
- The 50-day moving average will be an important support zone, and if breached, further downside movement could be expected.
For now, traders should closely monitor whether the market shows resilience near the choice dose level 23200 or if selling pressure continues, confirming the bearish momentum.
Conclusion
Despite FII inflows turning positive, the market surprised traders today by making a sharp downside move. This could be attributed to profit booking after a 7-day winning streak. The banking sector showed strength, but the overall sentiment was complicated by the IT sector’s weakness, which contributed to the decline.
Looking ahead, the focus will be on next week’s RBI monetary policy. Given the market’s strong streak movement in the past seven sessions, there hasn’t been a clear technical support level. However, the 50-day moving average near the 10,000 level could act as a strong support zone.
If the market finds stability around this level, we might see a rebound, especially if the RBI policy outcome brings positive cues. Traders should keep an eye on central bank statements, as they could provide clarity on future market direction.
1 thought on “Trade setup for 27 March; Nifty 22500, US GDP data, Russia- Ukraine ceasefire impact, option chain analysis”