| Particulars | Value |
| Enterprise Value | ₹1,118.03 crore |
| Less: Net Debt | ₹44.81 crore |
| Add: Cash & Investments | ₹21.69 crore |
| Equity Value | ₹1,094.91 crore |
| Shares Outstanding | 6.43 crore |
| Fair Value per Share | ₹170.36 |
| Upper Band Price | ₹130 |
| Upside/Downside | 31.04% |
Business Model and Revenue Forecast
SRIT India Limited is an IT and IT-enabled services company that provides digital solutions, system integration, automation and technology services to government and enterprise customers. Its business is divided into three main verticals: electronic governance, telecommunications and broadband, and healthcare. Electronic governance is currently the largest contributor, accounting for approximately 68.39% of FY26 revenue.
The company generates revenue through a combination of software deployment, implementation, system integration, customization, maintenance and managed services. Its healthcare business also includes the Renaissance Health Enterprise Suite (RHES), while the company is expanding its capabilities in cloud, AI and other digital solutions.
SRIT has an outstanding order book of approximately ₹1,204.72 crore as of June 30, 2026, providing visibility for future revenue. The FY26 order book was approximately ₹1,182.82 crore, with electronic governance contributing around 58.40%, telecommunications and broadband 38.01%, and healthcare 3.59%.
Revenue growth was approximately 63% in FY24, 56% in FY25 and 16% in FY26 based on the financial performance table in the model. For the DCF forecast, the model uses 20% revenue growth in FY27, followed by a 2% annual tapering, resulting in growth of 18%, 16%, 14% and 12% through FY31. A terminal growth rate of 5% is used in the valuation. These assumptions provide a structured basis for estimating future revenue while allowing for a gradual moderation in growth.
Also read : Orient cable Valuation analysis
lso read; Runwal Enterprises IPO Valuation Analysis
Also read;Valuation Analysis of German Green Steel IPO
Valuation Analysis
The DCF model uses the following key assumptions. These are model assumptions and should not be treated as company guidance.
| Key Assumption | Model Input | Remark |
| Revenue Growth % | 20.00% | Starting revenue-growth assumption |
| Annual Growth Tapering | 2.00% | Growth is assumed to become lower each year |
| Terminal Growth Rate | 5.00% | Long-term growth assumption after the explicit forecast period |
| WACC | 9.00% | Discount rate used in the DCF valuation |
Financial Performance (₹ Crores)
| Particulars | 2022 | 2023 | 2024 | 2025 | 2026 |
| Sales | 195.74 | 153.25 | 249.97 | 389.35 | 450.00 |
| % growth | 0% | -22% | 63% | 56% | 16% |
| Gross Profit | 53.45 | 62.00 | 75.69 | 101.31 | 126.77 |
| % margin | 27% | 40% | 30% | 26% | 28% |
| Operating Expenses | 39.61 | 38.87 | 48.85 | 51.50 | 62.00 |
| % of revenue | 20% | 25% | 20% | 13% | 14% |
| EBITDA | 13.84 | 23.13 | 26.84 | 49.81 | 64.77 |
| % margin | 7% | 15% | 11% | 13% | 14% |
| Depreciation | 1.03 | 0.92 | 0.92 | 2.74 | 8.60 |
| % of sales | 0.53% | 0.60% | 0.37% | 0.70% | 1.91% |
| EBIT | 12.81 | 22.21 | 25.92 | 47.07 | 56.17 |
| % margin | 7% | 14% | 10% | 12% | 12% |
| Other Income | 1.55 | 60.09 | 4.39 | 11.16 | 12.54 |
| Interest | 1.34 | 1.58 | 3.18 | 12.03 | 13.76 |
| % of debt | 2% | 9% | 13% | 19% | 31% |
| Profit before tax | 13.02 | 80.72 | 27.13 | 46.20 | 54.95 |
| % of revenue | 7% | 53% | 11% | 12% | 12% |
| Tax | 6.46 | 7.40 | 8.29 | 12.59 | 11.66 |
| % of PBT | 50% | 9% | 31% | 27% | 21% |
| Net profit | 6.56 | 73.32 | 18.84 | 33.61 | 43.29 |
| % of revenue | 3% | 48% | 8% | 9% | 10% |
Revenue Projections & Growth Assumptions
| Year | FY27E | FY28E | FY29E | FY30E | FY31E |
| Revenue Growth % | 20% | 18% | 16% | 14% | 12% |
| Revenue (in Crs.) | 540.00 | 637.20 | 739.15 | 842.63 | 943.75 |
Free Cash Flow Projections (₹ Crores)
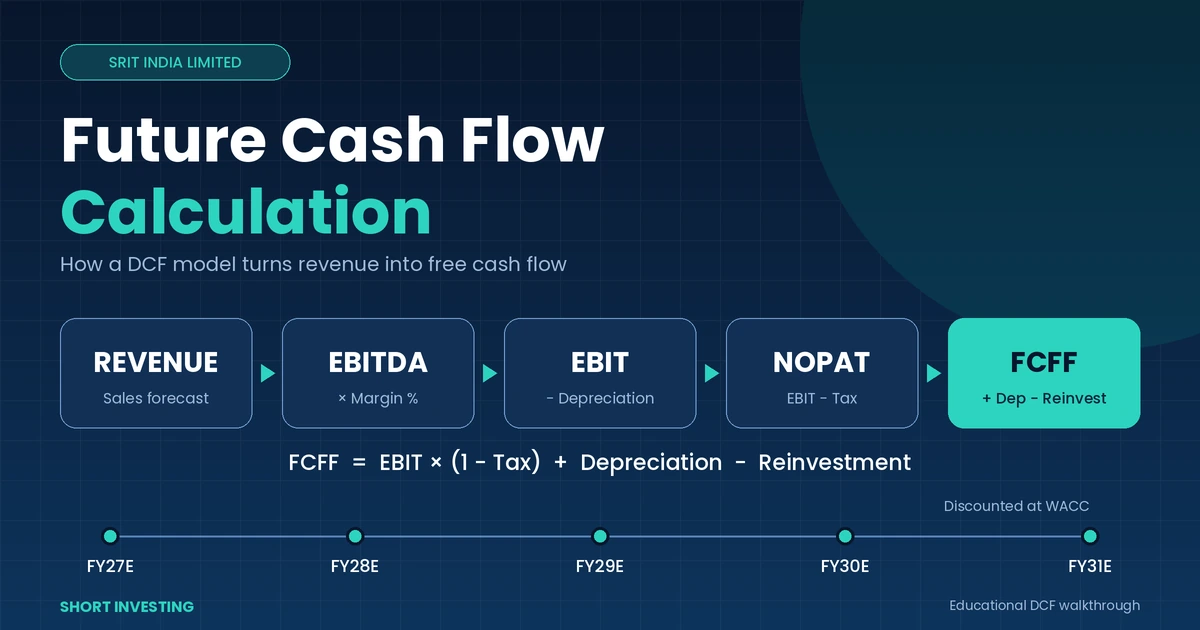
| Particulars | FY27E | FY28E | FY29E | FY30E | FY31E |
| Revenue | 540.00 | 637.20 | 739.15 | 842.63 | 943.75 |
| EBITDA Margin % | 14% | 14% | 14% | 14% | 14% |
| EBITDA | 77.72 | 91.71 | 106.39 | 121.28 | 135.84 |
| Less: Depreciation | 4.44 | 5.24 | 6.07 | 6.93 | 7.76 |
| EBIT | 73.29 | 86.48 | 100.31 | 114.36 | 128.08 |
| Less: Tax | 18.32 | 21.62 | 25.08 | 28.59 | 32.02 |
| NOPAT | 54.96 | 64.86 | 75.24 | 85.77 | 96.06 |
| Add: Depreciation | 4.44 | 5.24 | 6.07 | 6.93 | 7.76 |
| Less: Reinvestment | -27.48 | -32.43 | -37.62 | -42.88 | -48.03 |
| Free Cash Flow to Firm | 31.92 | 37.67 | 43.69 | 49.81 | 55.79 |
Where Our Analysis Could Fail
Our valuation rests on the assumptions used for revenue growth, WACC, terminal growth, margins and reinvestment. The model uses 20% revenue growth in FY27, a 2% annual tapering, a 5% terminal growth rate and a 9% WACC. Because DCF valuation depends heavily on future cash flows and the discount rate, changes in these assumptions can materially change the estimated fair value.
The model assumes revenue growth will re-accelerate to 20% in FY27 after the 16% growth recorded in FY26, before gradually declining to 12% by FY31. This could prove optimistic if the company’s order conversion is slower than expected, government projects are delayed, or project execution takes longer. Conversely, stronger order conversion or sustained demand could result in revenue growth above the model assumptions.
The model maintains an EBITDA margin of 14% throughout the forecast period. Actual margins could differ because of changes in project mix, employee costs, subcontracting costs, pricing, execution expenses and other operating costs. A lower margin would reduce operating cash flows and therefore reduce the DCF value.
The company’s business has significant exposure to government customers and electronic governance is the largest contributor to revenue and the order book. Delays in tenders, approvals, project implementation or customer payments could affect the timing of revenue and cash flows. The order book provides visibility but does not guarantee that all orders will be converted into revenue within the period assumed by the model.
The 5% terminal growth rate is another important valuation assumption. A lower terminal growth rate would reduce the terminal value, while a higher rate would increase it. The same applies to WACC: a higher discount rate would reduce the present value of future cash flows.
The model’s reinvestment assumptions also affect free cash flow. If the company needs to invest more working capital, technology spending or other capital to support growth than assumed in the model, actual free cash flow could be lower than the forecast.
The scenario analysis demonstrates how sensitive the valuation is to revenue growth assumptions. The model’s best-case scenario uses growth of 25%, 23%, 21%, 19% and 17%, resulting in a DCF price of ₹209. The worst-case scenario uses growth of 15%, 13%, 11%, 9% and 7%, resulting in a DCF price of ₹138. These scenarios are model outcomes under different assumptions and are not predictions of the future share price.
Overall, this valuation is an estimate based on the assumptions in the model. If actual revenue growth, margins, reinvestment requirements, WACC, terminal growth or the timing of order conversion differ materially from our assumptions, the fair value can change significantly.
Scenario Analysis
| Scenario | FY27E | FY28E | FY29E | FY30E | FY31E | DCF Price |
| Best Case | 25% | 23% | 21% | 19% | 17% | ₹209 |
| Worst Case | 15% | 13% | 11% | 9% | 7% | ₹138 |
Sensitivity Analysis
DCF price under different Terminal Growth and WACC assumptions:
| Terminal Growth / WACC | 9.01% | 9.51% | 10.01% | 10.51% | 11.01% | 11.51% |
| 2% | 104 | 97 | 90 | 84 | 79 | 74 |
| 3% | 119 | 109 | 101 | 93 | 87 | 81 |
| 4% | 139 | 126 | 115 | 105 | 97 | 90 |
| 5% | 170 | 150 | 134 | 121 | 111 | 102 |
| 6% | 221 | 188 | 164 | 145 | 130 | 117 |
Conclusion
The DCF model values SRIT India Limited at ₹170.36 per share under the assumptions used in the sheet. The valuation is supported by the projected revenue growth and free cash flow generation, but the outcome remains sensitive to growth, margins, reinvestment, WACC and terminal growth assumptions. The scenario and sensitivity analysis should therefore be read together with the base-case valuation rather than relying on a single fair-value figure.