DCF-based valuation and business analysis
| Particulars | Value |
| Enterprise Value | ₹8,196.78 crore |
| Less: Total Borrowings | ₹2,931.60 crore |
| Add: Cash & Investments | ₹275.21 crore |
| Equity Value | ₹5,540.39 crore |
| Post-issue Shares Outstanding | 14.7784878 crore |
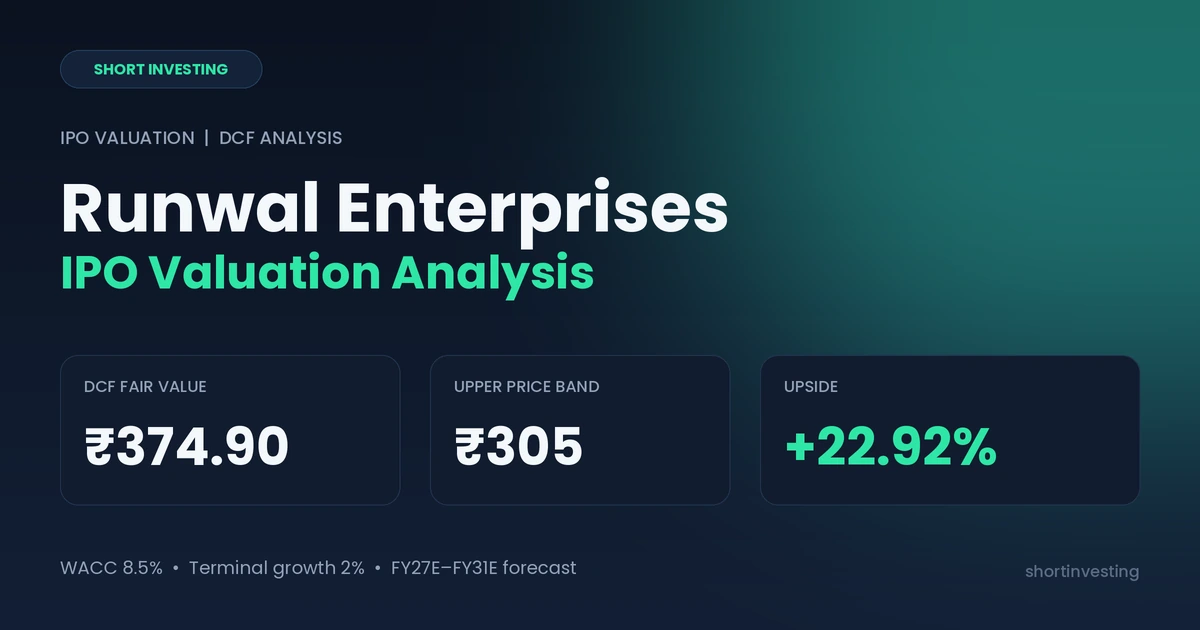
| Fair Value per Share | ₹374.90 |
| Upper Band Price | ₹305.00 |
| Upside / (Downside) | 22.92% |
The original sheet used ₹2,931.60 crore as debt. This has been corrected to the FY2026 total borrowings of ₹2,931.60 crore. Cash is shown separately, so the equity-value bridge is Enterprise Value less total borrowings plus cash.
Business Model and Revenue Forecast
The company is mainly operating in Mumbai and is primarily engaged in the real estate business. The company has a portfolio of residential projects, retail and commercial projects, schools and educational buildings, and other types of real estate projects.
The main business of the company comes from Mumbai, which is why the company has witnessed strong revenue growth over the past couple of years. The company is now also geographically expanding its business outside Mumbai. Currently, the company is operating 80 projects, of which 78 are in Mumbai and two are located outside Mumbai.
This is the core business of the company. The company also has a residential portfolio that accounts for nearly 85% of its total portfolio, while the remaining 15% consists of non-residential projects.
Since the company has shown strong growth in its business, with revenue growth of approximately 189% in FY2024, 52% in FY2025, and 79% in FY2026, it is important to understand and determine an appropriate growth rate because the historical growth rate has been high and volatile.
Here, we have assumed a 45% growth rate for the business, along with a 2% tapering rate and a terminal growth rate of 2%. The reason for considering a lower terminal growth rate is that there is significant competition in the real estate business, and the company is mainly operating in Mumbai.
After a certain period, when the company’s business becomes significantly larger, it may need to expand into other cities to maintain consistent growth, which could present additional challenges. Therefore, we have considered a 45% growth rate for revenue, and based on these assumptions, we have derived the valuation for the company.
Also read; Moneyview IPO – DCF Valuation Analysis
Also read;Valuation Analysis of German Green Steel IPO
Also read; Valuation Analysis of A-One Steels
Valuation Analysis
| Key Assumption | Value | Remark |
| Revenue Growth % | 45.00% | We have taken this as the starting revenue-growth assumption. |
| Annual Growth Tapering | 2.00% | We expect growth to be lower by 2 percentage points each year. |
| Terminal Growth Rate | 2.00% | We expect this to be the company’s long-term growth rate after the explicit forecast period. |
| WACC | 8.50% | Discount rate used in the base-case DCF model. |
Financial Performance (₹ Crores)
INCOME STATEMENT
| Particulars | FY2022 | FY2023 | FY2024 | FY2025 | FY2026 |
| Sales / Revenue from Operations | 61.36 | 229.49 | 2,408.87 | 1,007.77 | 1,798.95 |
| % Growth | 0% | 274% | 189% | 52% | 79% |
| EBITDA | -65.34 | -3.83 | 201.73 | 180.11 | 349.81 |
| EBITDA Margin | -106% | -2% | 8.37% | 17.87% | 19.44% |
| Depreciation | 0.44 | 0.58 | 3.18 | 3.69 | 10.72 |
| EBIT | -65.78 | -4.41 | 198.55 | 176.42 | 339.09 |
| Other Income | 1.40 | 5.03 | 27.81 | 42.95 | 51.84 |
| Finance Cost / Interest | 4.55 | 18.67 | 41.78 | 78.86 | 115.16 |
| Profit Before Tax | -68.93 | -18.05 | 156.77 | 97.56 | 223.92 |
| Tax | -17.94 | -11.31 | 63.07 | 41.91 | 38.15 |
| Net Profit | -50.99 | -6.74 | 93.70 | 55.65 | 185.76 |
| Net Profit Margin | -83% | -3% | 3.89% | 5.52% | 10.33% |
Note: The FY2024–FY2026 figures have been aligned with the reported restated financial information. The original Gross Profit and Operating Expenses rows were not retained because they did not reconcile cleanly with the reported EBITDA figures.
Revenue Projections & Growth Assumptions
| Year | FY27E | FY28E | FY29E | FY30E | FY31E |
| Revenue Growth % | 45% | 43% | 41% | 39% | 37% |
| Revenue (₹ crore) | 2,608.48 | 3,730.12 | 5,259.47 | 7,310.67 | 10,015.61 |
Free Cash Flow Projections (₹ Crores)
| Particulars | FY27E | FY28E | FY29E | FY30E | FY31E |
| Revenue | 2,608.48 | 3,730.12 | 5,259.47 | 7,310.67 | 10,015.61 |
| EBITDA Margin % | 17% | 17% | 17% | 17% | 17% |
| EBITDA | 432.67 | 618.71 | 872.38 | 1,212.61 | 1,661.28 |
| Less: Depreciation | 11.58 | 16.56 | 23.36 | 32.46 | 44.48 |
| EBIT | 421.08 | 602.15 | 849.03 | 1,180.15 | 1,616.80 |
| Less: Tax | 105.27 | 150.54 | 212.26 | 295.04 | 404.20 |
| NOPAT | 315.81 | 451.61 | 636.77 | 885.11 | 1,212.60 |
| Add: Depreciation | 11.58 | 16.56 | 23.36 | 32.46 | 44.48 |
| Less: Reinvestment | (157.91) | (225.81) | (318.39) | (442.56) | (606.30) |
| Free Cash Flow to Firm | 169.49 | 242.37 | 341.74 | 475.02 | 650.78 |
The FCFF projections retain the assumptions from the original model: 17% EBITDA margin, the stated depreciation schedule and the stated reinvestment amounts.
Where Our Analysis Could Fail
The company is mainly engaged in the real estate business and operates primarily in Mumbai. Mumbai is considered to have relatively strong growth potential compared with many other parts of India in terms of the real estate business, which is one of the reasons why the company has historically reported a high growth rate.
There are also a couple of key parameters that we need to focus on. One of them is supplier concentration. According to the FY2026 data, 76% of the company’s supplies are coming from its top 10 suppliers, which is an important consideration.
Another key factor is the company’s strong project pipeline for the upcoming years. Currently, the company has around 56.41 million square feet of upcoming projects, which is higher than the total area the company has completed so far. This is important to understand because it could represent a significant opportunity for future growth, but at the same time, it could also become a risk for the company if these projects are not executed properly.
If the company is able to execute these upcoming projects successfully, we could see the company’s valuation being significantly higher than the valuation we are seeing currently. Apart from this, debt is also a concern that needs to be closely monitored. The company had total borrowings of approximately ₹2,931.60 crore as of FY2026. In addition, approximately ₹325 crore of the IPO proceeds is proposed to be used for repayment or prepayment of borrowings.
Therefore, these are the key factors that need to be focused on. If the company successfully executes its upcoming projects while managing and balancing its debt, the company’s valuation could be higher. However, if execution is weaker than expected or the company faces challenges in managing its debt, the valuation could be lower than our current estimate.
Scenario Analysis
| Scenario | FY27E | FY28E | FY29E | FY30E | FY31E | DCF Price |
| Best Case | 50% | 48% | 46% | 44% | 42% | ₹475 |
| Worst Case | 40% | 38% | 36% | 34% | 32% | ₹288 |
The scenario DCF prices are retained from the source model. The source does not provide all scenario-specific inputs needed to independently reproduce these two outputs, so they have not been recalculated.
Sensitivity Analysis
| Terminal Growth / WACC | 9.01% | 9.51% | 10.01% | 10.51% | 11.01% | 11.51% |
| 2% | 330 | 292 | 259 | 229 | 204 | 180 |
| 3% | 404 | 354 | 312 | 276 | 244 | 216 |
| 4% | 507 | 440 | 383 | 336 | 295 | 260 |
| 5% | 662 | 562 | 483 | 418 | 364 | 318 |
| 6% | 920 | 755 | 632 | 537 | 460 | 398 |
The sensitivity table is retained in the same structure as the source. Note that the source table starts at a 9.01% WACC, while the base DCF assumption is 8.50%; therefore, the sensitivity table does not directly show the base-case WACC.
Frequently Asked Questions (FAQs)
1. What is the DCF fair value of Runwal Enterprises in this analysis?
Based on the corrected base-case DCF bridge and the stated model assumptions, the estimated fair value is approximately ₹374.90 per share.
2. What WACC and terminal growth rate are used in the DCF?
The base case uses an 8.50% WACC and a 2.00% terminal growth rate.
3. What revenue growth rate has been assumed?
The model assumes 45% revenue growth in FY27E, followed by a 2 percentage-point annual taper, resulting in 43%, 41%, 39% and 37% growth from FY28E to FY31E.
4. What are the key factors that could affect the valuation?
The key factors include execution of the upcoming project pipeline, Mumbai market concentration, debt levels, supplier concentration, and the ability to sustain the assumed revenue and margin profile.
5. Why can the DCF value change significantly?
DCF valuation is sensitive to assumptions such as revenue growth, EBITDA margin, reinvestment, WACC and terminal growth. Changes in any of these assumptions can materially change the estimated equity value and fair value per share.
Model note: This valuation is a model output based on the assumptions stated above and should not be treated as a guaranteed market price.