| Particular | Value |
| Enterprise Value | 4,379.86 |
| Less: Net Debt | 1,052.35 |
| Add: Cash & Investments | 100.20 |
| Equity Value | 3,427.71 |
| Shares Outstanding | 7.72 |
| Fair Value per Share | 443.74 |
| Upper Band Price | 405.00 |
| Upside / (Downside) | 9.57% |
Business Model and Revenue Forecast
The company mainly operates in Southern India, particularly in the states of Karnataka and Andhra Pradesh. As the name suggests, the company is primarily engaged in steel manufacturing. It is also an intermediate steel-making company that produces various key products, such as metallurgical coke, ferro alloys, TMT bars, MS billets, and other related steel products.
The company’s business process is relatively straightforward. It starts with raw materials, which are used to produce sponge iron, followed by MS billets. These billets are further processed into final products such as TMT bars, pipes, and coils.
The company’s steel manufacturing capacity is increasing. In FY26, the company had an installed capacity of 17.33 lakh MTPA, which is one of the key factors supporting its business growth. Apart from this, the company has different product streams and product categories, which are illustrated in the table below.
Also read: NSE IPO Valuation Analysis
Also read; Valuation Analysis of German Green Steel IPO
Valuation Analysis
| Key Assumption | Value | Remark |
| Revenue Growth % | 18.00% | We have taken this as the initial growth assumption for FY27E. |
| Annual Growth Tapering | 2.00 percentage points | We expect the growth rate to be lower by 2 percentage points each year. |
| Terminal Growth Rate | 5.00% | We expect the company to reach this long-term growth rate after the explicit forecast period. |
| WACC | 9.00% | The WACC represents the discount rate used to calculate the present value of future cash flows. It should be supported by the company’s risk profile, capital structure, and sector characteristics. |
Financial Performance (₹ Crores)
INCOME STATEMENT
| Particulars | 2022 | 2023 | 2024 | 2025 | 2026 |
| Sales | 2,756.84 | 3,163.52 | 3,834.21 | 3,542.22 | 4,148.57 |
| % growth | — | 14.75% | 21.20% | -7.61% | 17.11% |
| Gross Profit | 247.06 | 303.64 | 295.90 | 298.42 | 419.57 |
| % margin | 8.96% | 9.60% | 7.72% | 8.42% | 10.11% |
| Operating Expenses | 67.21 | 83.65 | 125.34 | 137.12 | 200.12 |
| % of revenue | 2.44% | 2.64% | 3.27% | 3.87% | 4.82% |
| EBITDA | 179.85 | 219.99 | 170.56 | 161.30 | 219.45 |
| % margin | 6.53% | 6.95% | 4.45% | 4.55% | 5.29% |
| Depreciation | 19.04 | 32.73 | 43.22 | 55.87 | 62.68 |
| % of sales | 0.69% | 1.03% | 1.13% | 1.58% | 1.51% |
| EBIT | 160.81 | 187.26 | 127.34 | 105.43 | 156.77 |
| % margin | 5.83% | 5.92% | 3.32% | 2.98% | 3.78% |
| Other Income | 4.36 | 18.28 | 28.23 | 33.57 | 117.73 |
| Interest | 30.50 | 70.70 | 97.39 | 113.15 | 109.19 |
| % of debt | 6% | 6% | 9% | 11% | 10% |
| Profit Before Tax | 134.67 | 134.84 | 58.18 | 25.85 | 165.31 |
| % of revenue | 4.89% | 4.26% | 1.52% | 0.73% | 3.98% |
| Tax | 34.03 | 37.13 | 19.97 | 15.13 | 37.75 |
| % of PBT | 25.27% | 27.53% | 34.32% | 58.53% | 22.84% |
| Net Profit | 100.64 | 97.71 | 38.21 | 10.72 | 127.56 |
| % of revenue | 3.65% | 3.09% | 1.00% | 0.30% | 3.08% |
Revenue Projections & Growth Assumptions
| Year | FY27E | FY28E | FY29E | FY30E | FY31E |
| Revenue Growth % | 18% | 16% | 14% | 12% | 10% |
| Revenue (in ₹ crore) | 4,895.31 | 5,678.56 | 6,473.56 | 7,250.39 | 7,975.43 |
Free Cash Flow Projections (₹ Crores)
| Particulars | FY27E | FY28E | FY29E | FY30E | FY31E |
| Revenue | 4,895.31 | 5,678.56 | 6,473.56 | 7,250.39 | 7,975.43 |
| EBITDA Margin % | 5% | 5% | 5% | 5% | 5% |
| EBITDA | 244.77 | 283.93 | 323.68 | 362.52 | 398.77 |
| Less: Depreciation | 58.16 | 67.47 | 76.91 | 86.14 | 94.76 |
| EBIT | 186.61 | 216.46 | 246.77 | 276.38 | 304.01 |
| Less: Tax | 46.65 | 54.12 | 61.69 | 69.10 | 76.00 |
| NOPAT | 139.96 | 162.34 | 185.08 | 207.29 | 228.01 |
| Add: Depreciation | 58.16 | 67.47 | 76.91 | 86.14 | 94.76 |
| Less: Reinvestment | -75.30 | -87.34 | -99.57 | -111.52 | -122.67 |
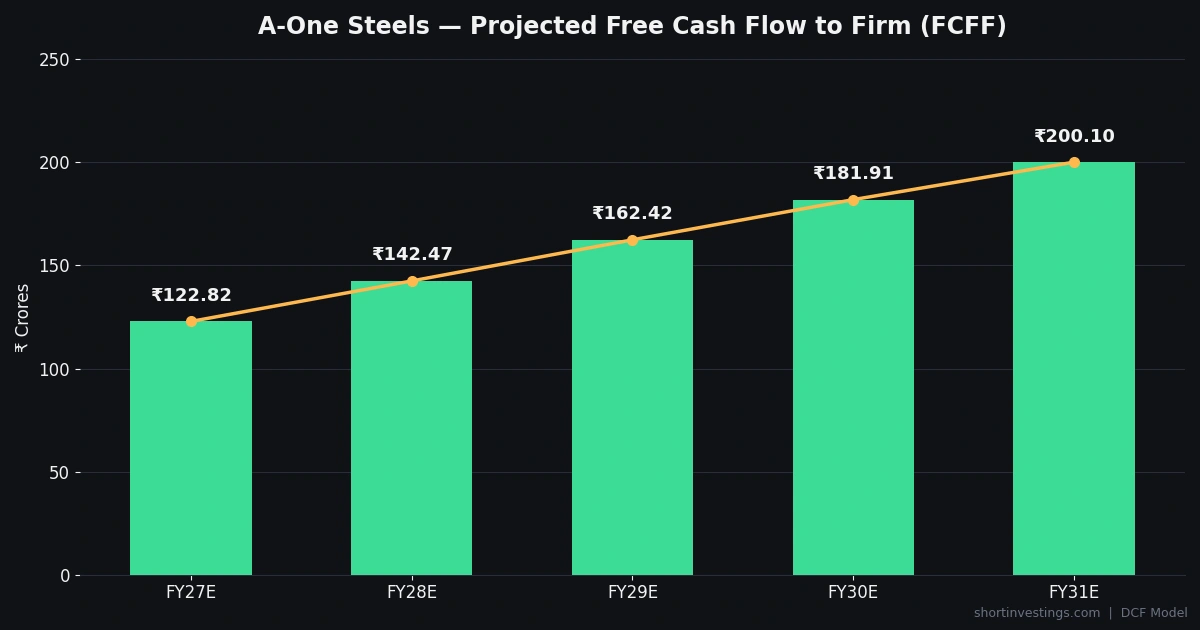
| Free Cash Flow to Firm | 122.82 | 142.47 | 162.42 | 181.91 | 200.10 |
Where Our Analysis Could Fail
In this analysis, we have assumed an 18% growth rate, which is based on the company’s FY26 growth performance of approximately 17%. Before that as well, the company had demonstrated growth in its business.
However, the company operates in a key segment where competition remains intense. If the company is able to maintain an 18% growth rate, our valuation would remain broadly in line with the assumptions used in the model. Since the valuation is based on assumptions, changes in these assumptions can materially affect the fair value calculated by the model.
We have also considered a 5% terminal growth rate in our assumptions. This could become challenging if the company is unable to achieve this growth rate after the explicit forecast period. In that case, the entire valuation model would need to be reassessed based on the revised parameters.
We can evaluate the impact of these assumptions and their effect on the stock price through sensitivity analysis, which shows how changes in the WACC and terminal growth rate could affect the estimated value per share.
Other Analysis
| Scenario | FY27E | FY28E | FY29E | FY30E | FY31E | DCF Price |
| Best Case | 23% | 21% | 19% | 17% | 15% | ₹571* |
| Worst Case | 13% | 11% | 9% | 7% | 5% | ₹336* |
* The original best-case and worst-case DCF prices are retained as source figures but require revalidation because the supporting DCF calculations are not provided in the sheet. **The base-case value is calculated from the stated 5% EBITDA margin, 9% WACC, and 5% terminal growth assumptions, using the sheet’s debt, cash, and share-count inputs provisionally.
Sensitivity Analysis
| Terminal Growth / WACC | 9.01% | 9.51% | 10.01% | 10.51% | 11.01% | 11.51% |
| 2% | 202 | 179 | 159 | 142 | 126 | 112 |
| 3% | 245 | 216 | 191 | 169 | 150 | 133 |
| 4% | 306 | 266 | 233 | 205 | 180 | 159 |
| 5% | 397 | 339 | 291 | 253 | 221 | 194 |
| 6% | 550 | 452 | 380 | 323 | 278 | 240 |
Note: The sensitivity table has been recalculated from the corrected FCFF schedule. The values are approximate fair value per share and use the debt, cash, and share-count inputs from the original sheet provisionally.
Frequently Asked Questions (FAQs)
1. What is the fair value of A-One Steels based on this DCF analysis?
Based on the stated base-case assumptions of 18% FY27E revenue growth, annual growth tapering of 2 percentage points, a 5% EBITDA margin, 9% WACC, and 5% terminal growth, the corrected DCF calculation gives an estimated fair value of approximately ₹398.78 per share, subject to verification of the debt, cash, and share-count inputs used in the model.
2. What revenue growth rate has been assumed in the DCF model?
The model assumes 18% revenue growth in FY27E. The growth rate then tapers by 2 percentage points each year, resulting in 16% in FY28E, 14% in FY29E, 12% in FY30E, and 10% in FY31E.
3. What EBITDA margin has been assumed for the forecast period?
The forecast assumes a 5% EBITDA margin for FY27E through FY31E. EBITDA is therefore calculated as 5% of projected revenue in each forecast year.
4. What are the main risks to the DCF valuation?
The valuation is sensitive to revenue growth, EBITDA margins, steel prices, raw-material costs, competition, capacity utilization, WACC, terminal growth, and reinvestment requirements. A change in any of these assumptions can materially change the estimated fair value.
5. Why can the DCF value differ from the IPO upper-band price?
The IPO upper-band price is determined through the IPO pricing process, whereas the DCF value is calculated from assumptions about future cash flows, discount rates and terminal growth. Therefore, the two values can differ materially, and the DCF result should be considered an assumption-driven estimate rather than a guaranteed market price.
Source / modelling note: Historical and company-specific figures are based on the supplied A-One Steels valuation sheet. Forecast figures are model assumptions. DCF outputs are sensitive to revenue growth, EBITDA margin, WACC, terminal growth, and reinvestment assumptions.