| Particulars | Value |
| Enterprise Value (₹ crore) | 3,466.83 |
| Less: Net Debt (₹ crore) | 234.28 |
| Add: Cash & Investments (₹ crore) | 13.25 |
| Equity Value (₹ crore) | 3,245.80 |
| Shares Outstanding (crore) | 11.38 |
| Fair Value per Share (₹) | 285.22 |
| Upper Band Price (₹) | 272.00 |
| Upside / Downside | 4.86% |
Business Model and Revenue Forecast
The company is primarily engaged in the manufacturing of networking cables and passive networking equipment. It has been operating in this business for nearly two decades and serves industries such as broadband, telecom, data centres, renewable energy, smart buildings, security and surveillance, FMEG and automotive. Its product portfolio includes networking cables, specialty power and optical fibre cables, cable harnesses, EV charging cable assemblies and other allied products.
The main business currently comes from Networking Cables and Solutions, which generated revenue of ₹916.57 crore in FY2026 and contributed around 78% of total revenue. At the same time, Specialty Power and Optical Fibre Cable Solutions is becoming a more meaningful part of the business, with revenue increasing from ₹98.09 crore in FY2025 to ₹250.39 crore in FY2026.
The company is also expanding into newer products such as E-beam irradiated specialty cables, solar junction boxes, tethered drone systems, cable harnesses, power cords and EV charging cables and guns. These products are intended for areas including renewable energy, data centres, e-mobility, defence, aerospace and railways. Commercial production of E-beam specialty cables has started, while the EV charging cables have received TÜV certification.
Revenue from operations increased by approximately 25% in FY2025 and 42% in FY2026. FY2026 growth was supported by a 26.41% increase in Networking Cables and Solutions and a much stronger 155.30% increase in Specialty Power and Optical Fibre Cable Solutions.
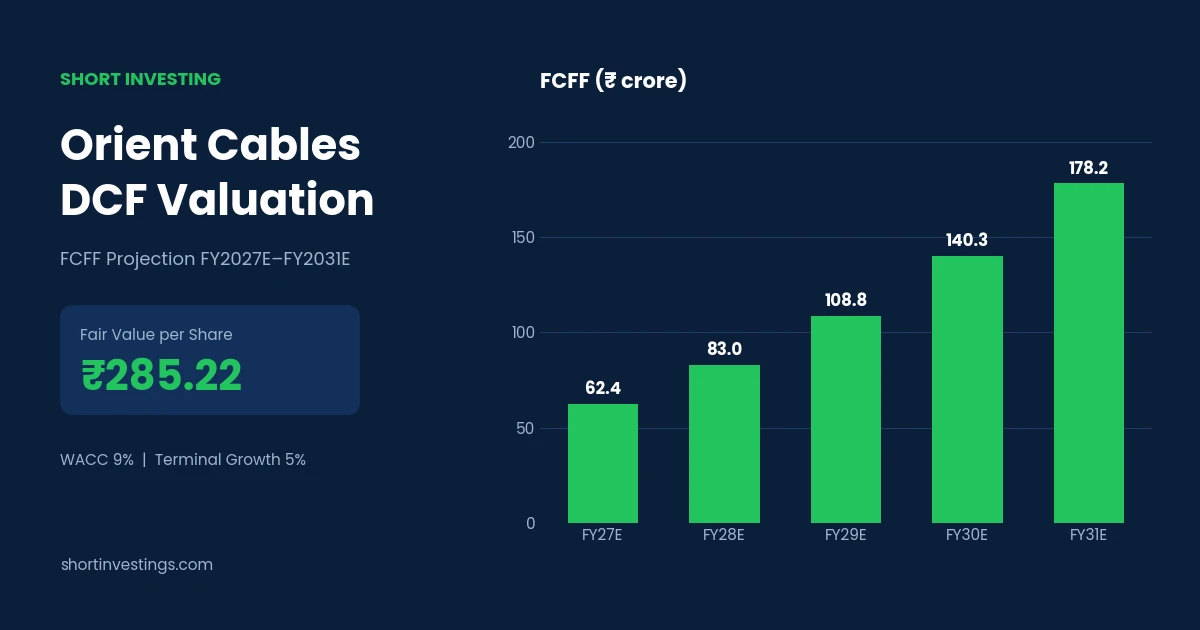
For the DCF, we have not assumed that the recent growth rate will continue at the same level indefinitely. The model starts with a 35% revenue growth assumption for FY2027 and reduces growth by 2 percentage points each year, resulting in growth of 35%, 33%, 31%, 29% and 27% from FY2027 to FY2031. We have used a 5% terminal growth rate and a 9% WACC.
The company is also expanding manufacturing capacity. Installed cable capacity was 895,776 km as of June 30, 2026, with the proposed expansion expected to take total capacity to approximately 1.26 million km, subject to installation and commissioning. Therefore, the forecast considers historical growth, capacity expansion and the potential contribution from newer products, while gradually reducing the growth rate as the revenue base becomes larger.
Also read; Runwal Enterprises IPO Valuation Analysis
Also read;Valuation Analysis of German Green Steel IPO
Also read; Valuation Analysis of A-One Steels
Key DCF Assumptions
| Parameter | Assumption |
| FY2027 Revenue Growth | 35.00% |
| Annual Growth Tapering | 2.00 percentage points |
| Terminal Growth Rate | 5.00% |
| WACC | 9.00% |
Historical Financial Performance
| Particulars | FY2024 | FY2025 | FY2026 |
| Sales (₹ crore) | 657.77 | 824.96 | 1,171.62 |
| Growth | — | 25% | 42% |
| Gross Profit (₹ crore) | 111.61 | 147.04 | 185.10 |
| Gross Margin | 17% | 18% | 16% |
| Operating Expenses (₹ crore) | 51.26 | 60.70 | 86.29 |
| EBITDA (₹ crore) | 60.35 | 86.34 | 98.81 |
| EBITDA Margin | 9% | 10% | 8% |
| Depreciation (₹ crore) | 6.11 | 6.56 | 14.71 |
| EBIT (₹ crore) | 54.24 | 79.78 | 84.10 |
| Other Income (₹ crore) | 7.07 | 6.90 | 10.01 |
| Interest (₹ crore) | 6.95 | 14.98 | 20.82 |
| PBT (₹ crore) | 54.36 | 71.70 | 73.29 |
| Tax (₹ crore) | 14.29 | 18.44 | 19.19 |
| Net Profit (₹ crore) | 40.07 | 53.26 | 54.10 |
Revenue Projections
| Year | Revenue Growth | Projected Revenue (₹ crore) |
| FY2027E | 35% | 1,581.69 |
| FY2028E | 33% | 2,103.64 |
| FY2029E | 31% | 2,755.77 |
| FY2030E | 29% | 3,554.95 |
| FY2031E | 27% | 4,514.78 |
FCFF Projections
| Particulars | FY2027E | FY2028E | FY2029E | FY2030E | FY2031E |
| EBITDA Margin | 8% | 8% | 8% | 8% | 8% |
| EBITDA (₹ crore) | 133.39 | 177.41 | 232.41 | 299.81 | 380.76 |
| Depreciation (₹ crore) | 19.86 | 26.41 | 34.60 | 44.63 | 56.68 |
| EBIT (₹ crore) | 113.54 | 151.00 | 197.81 | 255.18 | 324.08 |
| Tax (₹ crore) | 28.38 | 37.75 | 49.45 | 63.79 | 81.02 |
| NOPAT (₹ crore) | 85.15 | 113.25 | 148.36 | 191.38 | 243.06 |
| Add: Depreciation (₹ crore) | 19.86 | 26.41 | 34.60 | 44.63 | 56.68 |
| Reinvestment (₹ crore) | (42.58) | (56.63) | (74.18) | (95.69) | (121.53) |
| FCFF (₹ crore) | 62.43 | 83.04 | 108.78 | 140.32 | 178.21 |
Where Our Analysis Could Fail
The main risk to this DCF is the revenue-growth assumption. The model starts with 35% growth in FY2027 and still assumes 27% growth by FY2031. If demand, capacity utilisation or the contribution from newer products is lower than expected, actual revenue could fall below the forecast.
Another important assumption is the 8% EBITDA margin used throughout the forecast period. The company reported an 8.23% EBITDA margin in FY2026, but margins have moved between 8% and 10% in the historical period. Changes in product mix, raw-material costs, pricing or operating leverage could therefore affect FCFF.
Capacity expansion is another execution factor. The forecast partly relies on the company increasing manufacturing capacity and scaling newer products. Delays in installation or commissioning, slower customer adoption or underutilisation of the expanded capacity could reduce the expected growth.
The DCF is also sensitive to WACC and terminal growth. A higher discount rate reduces present value, while a lower terminal growth rate reduces the terminal value. This is particularly important because the model uses a 5% terminal growth rate.
Finally, the reinvestment assumptions need to support the projected growth. If the company requires more working capital or capital expenditure than assumed, free cash flow could be lower even if revenue growth remains strong.
Scenario Analysis
The updated scenario analysis uses the following growth paths. The Best Case assumes higher growth than the base case, while the Worst Case assumes lower growth. The DCF prices below are the updated values provided in the model.
| Scenario | FY27 | FY28 | FY29 | FY30 | FY31 | DCF Price (₹) |
| Best Case | 40% | 38% | 36% | 34% | 32% | 345 |
| Base Case | 35% | 33% | 31% | 29% | 27% | 285.22 |
| Worst Case | 30% | 28% | 26% | 24% | 22% | 272 |
Sensitivity Analysis
| Terminal Growth \ WACC | 9.01% | 9.51% | 10.01% | 10.51% | 11.01% | 11.51% |
| 2% | 166 | 152 | 141 | 130 | 121 | 113 |
| 3% | 192 | 175 | 160 | 147 | 135 | 125 |
| 4% | 229 | 205 | 185 | 168 | 154 | 141 |
| 5% | 284 | 249 | 220 | 197 | 178 | 162 |
| 6% | 376 | 317 | 273 | 239 | 212 | 190 |