Jindal Supreme is set to list on the market on 21 September. With the IPO currently open and bidding underway, valuation is one of the key factors investors should weigh. The stock is commanding a grey market premium of more than 30%, trading nearly ₹30 above the upper-band IPO price of ₹93.
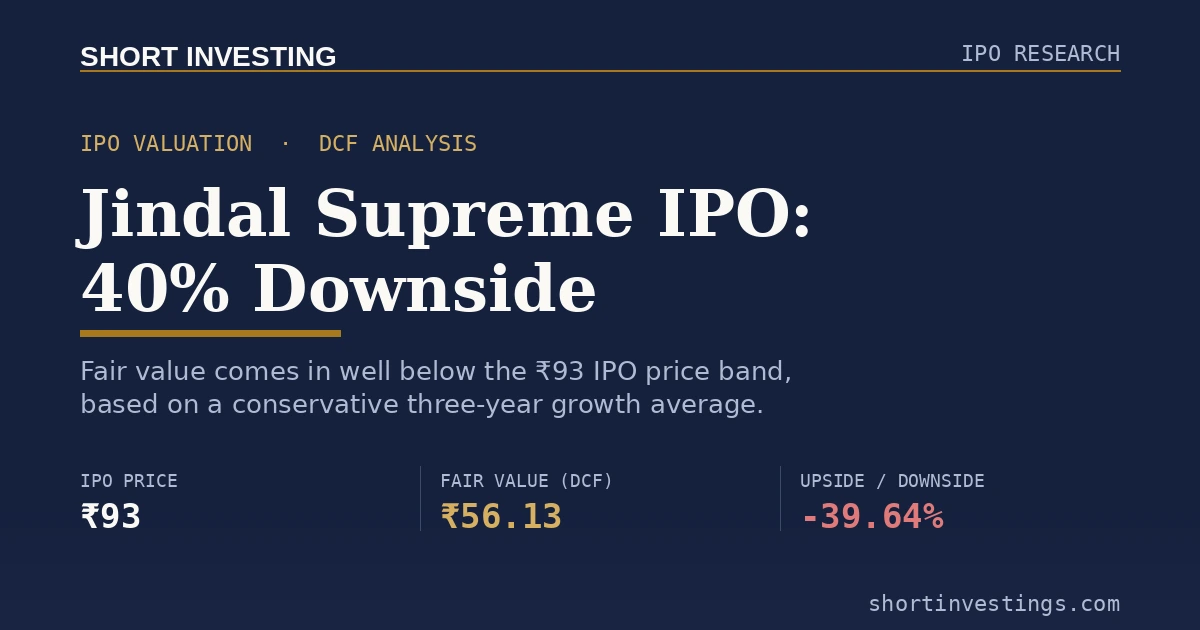
However, the company’s growth over the last few years has been inconsistent. Based on the average revenue growth of the last three years and a set of conservative assumptions, our discounted cash flow (DCF) analysis puts fair value at around ₹56 per share — nearly 40% below the IPO price.
| ₹ Crores | |
|---|---|
| Enterprise Value | 408.95 |
| Less: Net Debt | 122.58 |
| Add: Cash & Investments | 0.01 |
| Equity Value | 286.38 |
| Shares Outstanding (Cr.) | 5.102 |
| Fair Value per Share | ₹56.13 |
| Current Market Price | ₹93 |
| Upside/Downside | -39.64% |
Business Model and Revenue Forecast
Jindal Supreme’s core business is steel pipe and tube manufacturing, run out of a single facility in Hisar, Haryana. The company sells to both consumers and wholesalers across four key segments: black pipes, galvanized pipes, crash barriers, and GI tubular poles. All four contribute meaningfully to revenue, with black pipes accounting for 42.98% and galvanized pipes for 26.57% of FY26 revenue.
Also read; NSE IPO Valuation analysis
Growth has been uneven: 28% in FY24, a decline of 9% in FY25, and a recovery to 15% in FY26. Averaged over the last three years, that works out to roughly 11% — the growth rate we’ve used as our base-case assumption.
| Key Assumption | Value |
|---|---|
| Revenue Growth % | 11.19% |
| Annual Growth Tapering | 2.00% |
| Terminal Growth Rate | 2.00% |
| WACC | 7.60% |
Financial Performance (₹ Crores)
Income Statement
| Particulars | 2022 | 2023 | 2024 | 2025 | 2026 |
|---|---|---|---|---|---|
| Sales | 384.58 | 506.12 | 645.44 | 586.4 | 675.39 |
| % growth | 0% | 32% | 28% | -9% | 15% |
| Gross Profit | 37.69 | 23.4 | 39.39 | 41.76 | 61.14 |
| % margin | 10% | 5% | 6% | 7% | 9% |
| Operating Expenses | 9.26 | 14.57 | 18.24 | 15.84 | 19.51 |
| % of revenue | 2% | 3% | 3% | 3% | 3% |
| EBITDA | 28.43 | 8.83 | 21.15 | 25.92 | 41.63 |
| % margin | 7% | 2% | 3% | 4% | 6% |
| Depreciation | 1.92 | 2.42 | 3.77 | 3.14 | 3.43 |
| % of sales | 0% | 0% | 1% | 1% | 1% |
| EBIT | 26.51 | 6.41 | 17.38 | 22.78 | 38.2 |
| % margin | 7% | 1% | 3% | 4% | 6% |
| Other Income | 1.17 | 0.37 | 5.39 | 18.34 | 0.55 |
| Interest | 2.68 | 4.47 | 7.7 | 8.73 | 8.6 |
| % of debt | 4% | 6% | 7% | 9% | 7% |
| Profit before Tax | 25 | 2.31 | 15.07 | 32.39 | 30.15 |
| % of revenue | 7% | 0% | 2% | 6% | 4% |
| Tax | 7.33 | 1.68 | 2.2 | 8.12 | 7.63 |
| % of PBT | 29% | 73% | 15% | 25% | 25% |
| Net Profit | 17.67 | 0.63 | 12.87 | 24.27 | 22.52 |
| % of revenue | 5% | 0% | 2% | 4% | 3% |
Revenue Projections & Growth Assumptions
| Year | FY27E | FY28E | FY29E | FY30E | FY31E |
|---|---|---|---|---|---|
| Revenue Growth % | 11% | 9% | 7% | 5% | 3% |
| Revenue (₹ Crores) | 750.93 | 819.91 | 878.82 | 924.39 | 953.83 |
Free Cash Flow Projections (₹ Crores)
| FY27E | FY28E | FY29E | FY30E | FY31E | |
|---|---|---|---|---|---|
| Revenue | 750.93 | 819.91 | 878.82 | 924.39 | 953.83 |
| EBITDA Margin % | 6% | 6% | 6% | 6% | 6% |
| EBITDA | 46.29 | 50.54 | 54.17 | 56.98 | 58.79 |
| Less: Depreciation | 3.91 | 4.27 | 4.58 | 4.82 | 4.97 |
| EBIT | 42.37 | 46.27 | 49.59 | 52.16 | 53.82 |
| Less: Tax | 10.59 | 11.57 | 12.40 | 13.04 | 13.46 |
| NOPAT | 31.78 | 34.70 | 37.19 | 39.12 | 40.37 |
| Add: Depreciation | 3.91 | 4.27 | 4.58 | 4.82 | 4.97 |
| Less: Reinvestment | -15.89 | -17.35 | -18.60 | -19.56 | -20.18 |
| Free Cash Flow to Firm | 19.80 | 21.62 | 23.17 | 24.38 | 25.15 |
Where Our Analysis Could Fail
Our valuation rests on three key assumptions: a WACC of 7.6%, a base-case revenue growth rate of 11%, and a growth taper down to a 2% terminal rate. Each of these carries risk in a different direction.
The 11% growth assumption is drawn from the company’s three-year average, even though FY26 growth alone came in at 15%. We’ve leaned toward the more conservative figure partly because of rising geopolitical risk — an escalation between Iran and the US, or a broader Middle East crisis, could push up metal prices and pressure margins. The 2% terminal growth rate reflects how fragmented and competitive the pipes and tubes sector is; with many players competing for share, we don’t see grounds for the company to sustain higher long-term growth.
If the Middle East situation eases and India’s infrastructure push continues to gather pace, the company’s growth could exceed our estimates, and the tapering assumption in particular would need to be revisited upward. Conversely, if growth stays inconsistent as it has for the past three years, our current fair value of ₹56 may prove to be the more realistic anchor.
Overall, this valuation reflects a conservative reading of the company’s growth history and the risks specific to its sector — not a prediction of where the stock will trade after listing.
Frequently Asked Questions
1. Why is the fair value so much lower than the IPO price? Our DCF fair value of ₹56.13 is based on the company’s average revenue growth over the last three years (~11%), not on its most recent FY26 growth of 15%. Because FY24–FY26 growth has been inconsistent — 28%, -9%, and 15% — we chose the more conservative three-year average as the base case, which pulls the valuation well below the ₹93 IPO price.
2. What is driving the grey market premium if the DCF value is lower? Grey market premium reflects near-term demand and sentiment around listing day, not a company’s intrinsic value. A premium above 30% suggests strong subscription interest, but that’s a separate signal from a fundamentals-based valuation like DCF, which looks at long-term cash flows rather than listing-day demand.
3. Which business segments matter most for Jindal Supreme’s revenue? Black pipes and galvanized pipes together account for close to 70% of FY26 revenue (42.98% and 26.57% respectively), with crash barriers and GI tubular poles making up the rest. Any change in demand or pricing for black and galvanized pipes will have an outsized effect on overall revenue.
4. What would need to change for the stock to be worth closer to ₹93? Growth would need to sustain closer to the FY26 rate of 15% rather than reverting to the three-year average, and the terminal growth rate would likely need to be higher than the 2% we’ve assumed. This is plausible if India’s infrastructure demand stays strong and if the Middle East-related risk to input costs and pricing doesn’t materialize.
5. What are the biggest risks to this valuation? The three assumptions that matter most are the WACC (7.6%), the base revenue growth rate (11%), and the terminal growth rate (2%). Geopolitical risk — particularly around Iran, the US, and the broader Middle East — could affect metal prices and margins, while a resolution of that risk combined with continued infrastructure spending could push growth (and fair value) higher than our base case.