Veegaland Developers’ grey market premium has been showing some volatility, with the premium currently around ₹16–₹20 above the upper IPO price band. The grey market price is around ₹160, while the upper price band is ₹140.
The IPO application period ends on 15th September, and the company is expected to make its stock market debut around 18th September. While the grey market premium indicates the possibility of gains at listing, our focus in this analysis is on the company’s fundamentals and its estimated fair value based on the DCF valuation.
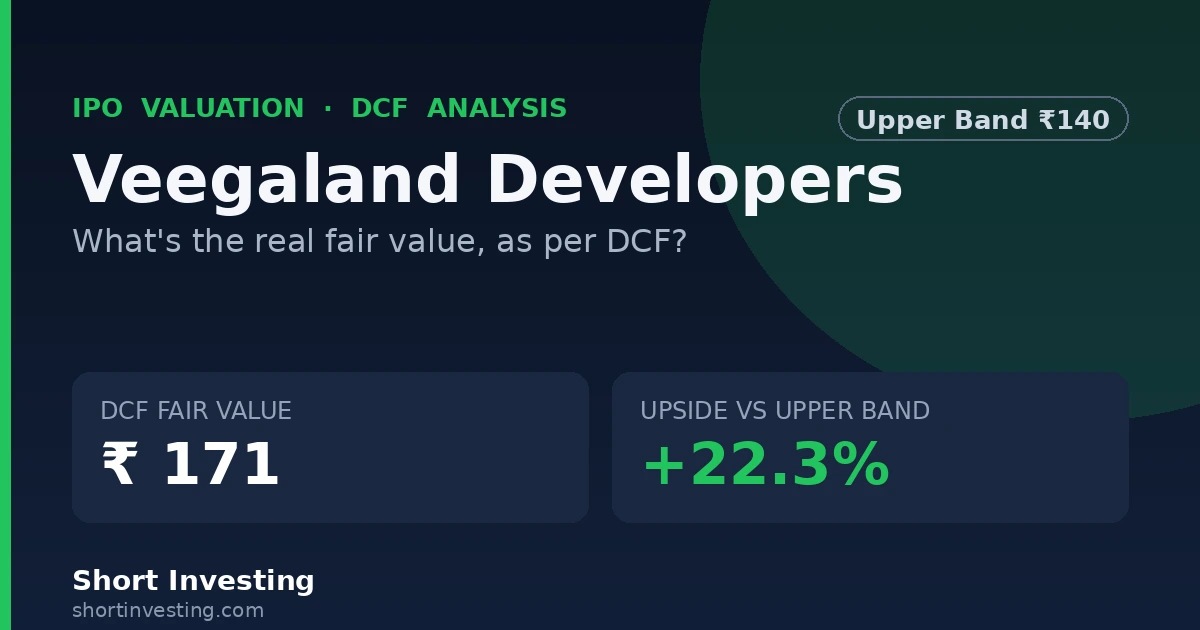
Based on our current assumptions, the estimated fair value of Veegaland Developers comes to around ₹171 per share, compared with the upper IPO price band of ₹140.
Valuation Analysis of Veegaland Developers
Veegaland Developers operates in the real estate business, where the company develops residential projects and sells them to customers. The company has also adopted a business model in which a significant portion of its revenue is recognized over the period of project development.
For example, when a project progresses and the company satisfies its performance obligations, the related revenue can be recognized progressively over time. This provides a different revenue-recognition structure compared with recognizing the entire revenue only after completion of the project.
Also read: How to Analyze an IPO
For our valuation analysis, we have considered the following key assumptions:
| Particulars | Assumption |
| Revenue Growth | 40% |
| Annual Growth Tapering | 2% |
| Terminal Growth Rate | 5.00% |
| Wacc rate | 11.00% |
| Tax Rate | 25.00% |
Financial Performance of Veegaland Developers
The company’s financial performance has improved over the years, with revenue increasing from ₹108.9 crore in FY2023 to ₹251.0 crore in FY2026. Net profit also increased from ₹14.5 crore in FY2023 to ₹26.6 crore in FY2026.
| Financial Performance (₹ Crores) | 2022A | 2023A | 2024A | 2025A | 2026A |
| Sales | 0.0 | 108.9 | 110.8 | 192.4 | 251.0 |
| % Growth | — | — | 2% | 74% | 30% |
| Cost of Goods Sold | 0.0 | 76.7 | 80.0 | 140.4 | 182.7 |
| % of Revenue | — | 70% | 72% | 73% | 73% |
| Gross Profit | 0.0 | 32.2 | 30.7 | 52.0 | 68.3 |
| % Margin | — | 29.6% | 27.7% | 27.0% | 27.2% |
| Operating Expenses | 0.0 | 9.2 | 17.9 | 22.0 | 28.8 |
| % of Revenue | — | 8% | 16% | 11% | 11% |
| EBITDA | 0.0 | 23.1 | 12.9 | 30.0 | 39.5 |
| % Margin | — | 21.2% | 11.6% | 15.6% | 15.7% |
| Depreciation | 0.0 | 0.4 | 0.4 | 0.5 | 0.7 |
| % of Sales | — | 0% | 0% | 0% | 0% |
| EBIT | 0.0 | 22.6 | 12.5 | 29.5 | 38.8 |
| % Margin | — | 20.8% | 11.2% | 15.3% | 15.4% |
| Other Income | 0.0 | 1.2 | 3.9 | 3.8 | 3.2 |
| Interest | 0.0 | 4.3 | 5.1 | 5.0 | 5.7 |
| % of Debt | — | 4% | 4% | 3% | 7% |
| Profit Before Tax | 0.0 | 19.5 | 11.2 | 28.3 | 36.2 |
| % of Revenue | — | 17.9% | 10.1% | 14.7% | 14.4% |
| Tax | 0.0 | 4.9 | 3.4 | 7.8 | 9.6 |
| % of PBT | — | 25% | 30% | 28% | 26% |
| Net Profit | 0.0 | 14.5 | 7.9 | 20.4 | 26.6 |
| % of Revenue | — | 13.4% | 7.1% | 10.6% | 10.6% |
Revenue Projections & Growth Assumptions
In FY2025, the company reported revenue growth of 74%, while revenue growth moderated to 30% in FY2026. Based on the company’s historical performance and our assessment of its future growth potential, we have assumed an annual revenue growth rate of 40% for the initial projection period.
We have also assumed that the annual growth rate will gradually taper by 2% each year.
| Year | FY27E | FY28E | FY29E | FY30E | FY31E |
| Revenue Growth % | 40% | 38% | 36% | 34% | 32% |
| Revenue (₹ Crores) | 351 | 485 | 659 | 884 | 1,166 |
Free Cash Flow Projections
Based on the projected revenue growth and an assumed EBITDA margin of 16%, we have estimated the company’s future free cash flow to the firm.
| Particulars (₹ Crores) | FY27E | FY28E | FY29E | FY30E | FY31E |
| Revenue | 351 | 485 | 659 | 884 | 1,166 |
| EBITDA Margin % | 16% | 16% | 16% | 16% | 16% |
| EBITDA | 55 | 76 | 104 | 139 | 183 |
| Less: Depreciation | 1.01 | 1.39 | 1.89 | 2.54 | 3.35 |
| EBIT | 54 | 75 | 102 | 136 | 180 |
| Less: Tax | 13.56 | 18.72 | 25.45 | 34.11 | 45.02 |
| NOPAT | 41 | 56 | 76 | 102 | 135 |
| Add: Depreciation | 1 | 1 | 2 | 3 | 3 |
| Less: Reinvestment | (20) | (28) | (38) | (51) | (68) |
| Free Cash Flow to Firm | 21 | 29 | 40 | 54 | 71 |
In FY2025, the company grew by 74%, while in FY2026, it grew by 30%. Therefore, we have taken a few key assumptions for the valuation, including an annual growth rate of 40%, a terminal growth rate of 5%, and a vacancy rate of 11%.
Based on these assumptions, our DCF analysis indicates an estimated fair value of approximately ₹171 per share. This is around 22% higher than the upper IPO price band of ₹140.
DCF Valuation
Based on our DCF analysis, the estimated enterprise value of the company comes to ₹886 crore. After considering debt and cash and investments, the estimated equity value comes to ₹834 crore.
With approximately 4.87 crore shares outstanding, the estimated fair value works out to around ₹171 per share.
| Valuation | Amount |
| Enterprise Value | ₹886 crore |
| Less: Net Debt | ₹86 crore |
| Add: Cash & Investments | ₹33 crore |
| Equity Value | ₹834 crore |
| Shares Outstanding | 4.87 crore |
| Fair Value per Share | ₹171 |
| Current Market Price / IPO Upper Band | ₹140 |
| Upside / Downside | 22.3% |
How Our DCF Valuation Could Change
Since Veegaland Developers operates in the real estate sector, its future growth will depend on factors such as project execution, sales, demand and the development of its land assets. The company has performed well in recent years, which supports our assumption of strong future growth.
Based on these factors, we have assumed a 40% annual growth rate for our DCF valuation. However, the actual growth achieved by the company could be different from our assumptions.
Accordingly, we have projected the future free cash flow and valuation, which gives us an estimated price of ₹171 per share.
However, the valuation is dependent on the key assumptions used in our analysis. We have assumed a Wacc rate of 11% and a growth rate of around 40%. Therefore, if the company’s performance in the next quarter or in future results causes these assumptions to change, the estimated valuation could also change.
For example, if the growth rate comes in lower, say around 30%, the valuation would decrease. On the other hand, if the growth rate is higher, such as 50%, the valuation would increase accordingly.
Keeping this in mind, our analysis has been conducted based on the current assumptions. If these assumptions change in the future, the estimated valuation could change as well.
Conclusion
The DCF valuation of Veegaland Developers is based on our current assumptions regarding the company’s future growth and financial performance. The estimated fair value should therefore not be considered a fixed target, as changes in the company’s future performance could affect the valuation.
If the company’s growth is lower than our expectations, the estimated fair value could decline. On the other hand, stronger-than-expected growth could support a higher valuation.
Based on our current assumptions and analysis, the estimated fair value of Veegaland Developers is approximately ₹171 per share, compared with the IPO upper price band of ₹140.