German Green Steel and Power Limited is set to be listed on the stock exchanges after its IPO. The IPO price band is ₹132–₹139 per share. Based on our DCF analysis, the estimated fair value is approximately ₹135.56 per share under the base-case assumptions used in this analysis.
DCF Valuation Bridge
| Particulars | ₹ Crores / Value |
| Enterprise Value | 1,333.68 |
| Less: Total Borrowings (Gross Debt) | 334.37 |
| Add: Cash & Investments | 22.08 |
| Equity Value | 1,021.40 |
| Shares Outstanding (post-issue) | 7.5349 crore |
| Fair Value per Share | ₹135.56 |
| IPO Upper Band Price | ₹139 |
| Upside / (Downside) | -2.48% |
Business Model and Revenue Forecast
German Green Steel and Power Limited is engaged in iron and steel manufacturing and operates primarily in Western India, with Gujarat being its key operating market. Its major products include TMT Bars, MS Billets and Sponge Iron. TMT Bars accounted for approximately 78.74% of FY26 product revenue.
The company is expanding its manufacturing capacity. Sponge Iron capacity is planned to increase from 66,000 MTPA to 148,500 MTPA, while TMT Bar capacity is planned to increase from 181,500 MTPA to 346,500 MTPA. MS Billets capacity is planned to increase from 214,500 TPA to 412,500 TPA.
The company has also entered into a Manufacturing Partner Agreement with JSW One Distribution Limited. This initiative is expected to support its distribution and manufacturing strategy.
Revenue growth was approximately 1% in FY24, 33% in FY25 and 11% in FY26. For the DCF model, we have used a 10% initial revenue-growth assumption, followed by a 2% annual tapering assumption and a 2% terminal growth rate. These assumptions are intended to provide a conservative basis for the forecast.
Also read ; Moneyview IPO – DCF Valuation Analysis
Also read; Jindal Supreme IPO Valuation
Valuation Analysis
| Key Assumption | Remark |
| Revenue Growth | 10.00% |
| Annual Growth Tapering | 2.00% |
| Terminal Growth Rate | 2.00% |
| WACC | 8.50% |
Financial Performance (₹ Crores)
INCOME STATEMENT
| Particulars | FY22 | FY23 | FY24 | FY25 | FY26 |
| Sales | 892.25 | 1,121.13 | 1,129.78 | 1,507.57 | 1,678.98 |
| % Growth | 0% | 26% | 1% | 33% | 11% |
| Gross Profit | 59.04 | 98.26 | 128.18 | 185.50 | 427.64 |
| % Margin | 7% | 9% | 11% | 12% | 25% |
| Operating Expenses | 21.40 | 46.67 | 48.84 | 68.70 | 260.69 |
| % Revenue | 2% | 4% | 4% | 5% | 16% |
| EBITDA | 37.64 | 51.59 | 79.34 | 116.80 | 166.96 |
| % Margin | 4% | 5% | 7% | 8% | 10% |
| Depreciation | 4.58 | 4.88 | 9.60 | 14.73 | 20.59 |
| % Sales | 0.51% | 0.44% | 0.85% | 0.98% | 1.23% |
| EBIT | 33.06 | 46.71 | 69.74 | 102.07 | 146.36 |
| % Margin | 4% | 4% | 6% | 7% | 9% |
| Other Income | 9.62 | 9.07 | 8.53 | 4.25 | 6.40 |
| Finance Costs | 7.20 | 6.88 | 22.10 | 32.67 | 42.96 |
| % Debt | 5% | 5% | 11% | 9% | 13% |
| PBT | 35.48 | 48.90 | 56.17 | 73.65 | 109.80 |
| % Revenue | 4% | 4% | 5% | 5% | 7% |
| Tax | 7.03 | 10.89 | 14.50 | 13.70 | 29.92 |
| % PBT | 20% | 22% | 26% | 19% | 27% |
| Net Profit | 28.45 | 38.01 | 41.67 | 59.95 | 79.89 |
| % Revenue | 3% | 3% | 4% | 4% | 5% |
FY26 EBITDA was approximately ₹166.96 crore, with an EBITDA margin of approximately 9.94%. For the forward DCF calculation, we have used a 10% EBITDA margin as the base assumption.
Revenue Projections & Growth Assumptions
| Particulars | FY27E | FY28E | FY29E | FY30E | FY31E |
| Revenue Growth | 10% | 8% | 6% | 4% | 2% |
| Revenue | 1,846.88 | 1,994.63 | 2,114.31 | 2,198.88 | 2,242.86 |
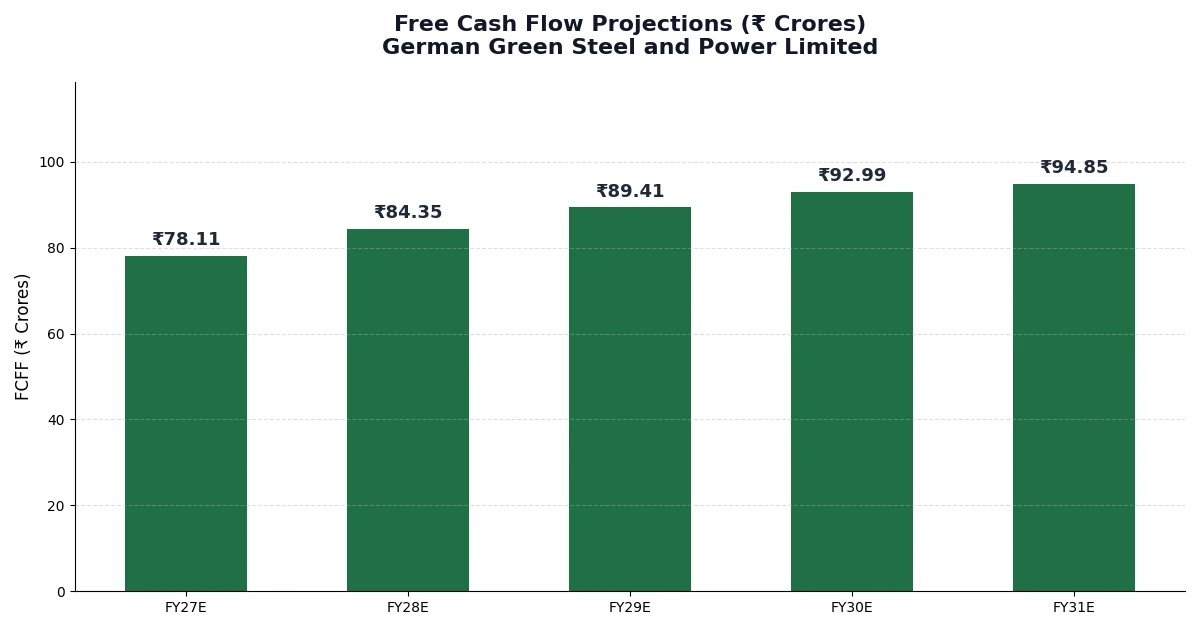
Free Cash Flow Projections (₹ Crores)
| Particulars | FY27E | FY28E | FY29E | FY30E | FY31E |
| Revenue | 1,846.88 | 1,994.63 | 2,114.31 | 2,198.88 | 2,242.86 |
| EBITDA Margin | 10% | 10% | 10% | 10% | 10% |
| EBITDA | 183.65 | 198.34 | 210.24 | 218.65 | 223.02 |
| Less: Depreciation | 14.78 | 15.96 | 16.92 | 17.60 | 17.95 |
| EBIT | 168.86 | 182.37 | 193.32 | 201.05 | 205.07 |
| Less: Tax | 42.22 | 45.59 | 48.33 | 50.26 | 51.27 |
| NOPAT | 126.65 | 136.78 | 144.99 | 150.79 | 153.80 |
| Add: Depreciation | 14.78 | 15.96 | 16.92 | 17.60 | 17.95 |
| Less: Reinvestment | (63.32) | (68.39) | (72.49) | (75.39) | (76.90) |
| FCFF | 78.11 | 84.35 | 89.41 | 92.99 | 94.85 |
Where Our Analysis Could Fail
The company’s business is mainly related to steel manufacturing, which is highly competitive and cyclical. Therefore, revenue growth and margins may not develop exactly as assumed in the DCF model. If the company delivers higher or lower growth than our assumptions, the estimated fair value can change materially.
The model also assumes a 10% EBITDA margin for future cash-flow calculations. FY26 EBITDA margin was approximately 9.94%, so the assumption is broadly aligned with the latest reported year. However, changes in steel prices, raw-material costs, power costs, imports, demand conditions and operating efficiency could affect future margins.
The company is also expanding capacity, which creates execution and reinvestment requirements. The DCF valuation is therefore sensitive to capital expenditure, working-capital requirements and the pace at which the expanded capacity generates revenue and cash flow.
The company has significant geographic concentration, with approximately 97.74% of FY26 revenue coming from Gujarat. Changes in regional demand or operating conditions could therefore affect performance.
Steel prices and demand can also be affected by global economic conditions, geopolitical events, trade policies and other external factors. These risks are not fully predictable and can cause actual results to differ from the forecast.
Scenario Analysis
| Case | FY27E | FY28E | FY29E | FY30E | FY31E | DCF Price |
| Bull Case | 15% | 13% | 11% | 9% | 7% | ₹177 |
| Base Case | 10% | 8% | 6% | 4% | 2% | ₹136 |
| Bear Case | 5% | 3% | 1% | -1% | -3% | ₹102 |
Sensitivity Analysis
| Terminal Growth / WACC | 9.01% | 9.51% | 10.01% | 10.51% | 11.01% | 11.51% |
| 2% | 123 | 112 | 102 | 93 | 86 | 79 |
| 3% | 144 | 129 | 117 | 107 | 97 | 89 |
| 4% | 173 | 154 | 138 | 124 | 112 | 102 |
| 5% | 218 | 189 | 166 | 147 | 132 | 118 |
| 6% | 292 | 244 | 209 | 181 | 159 | 141 |
Sensitivity values represent the estimated fair value per share under different WACC and terminal-growth assumptions.
Frequently Asked Questions (FAQs)
1. What is the fair value of German Green Steel and Power Limited as per the DCF analysis?
Under the base-case assumptions used in this analysis, the estimated fair value is approximately ₹135.56 per share.
2. What are the key assumptions used in the DCF valuation?
The model uses 10% initial revenue growth, a 2% annual growth tapering assumption, 2% terminal growth and an 8.50% WACC. The forward EBITDA margin is assumed at 10%.
3. Why can the DCF valuation change significantly?
DCF valuation is sensitive to revenue growth, EBITDA margins, reinvestment requirements, WACC and terminal growth. Changes in steel prices, raw-material costs, demand, imports and execution of capacity expansion can also affect actual results.
4. What is the major business concentration risk for the company?
The company has significant geographic concentration. Approximately 97.74% of FY26 revenue came from Gujarat. This concentration means regional demand and operating conditions can have a meaningful effect on the company’s performance.
5. What is the current GMP of the IPO?
As of 27 September 2026, one current GMP tracker reported an unofficial GMP of approximately ₹27.5. GMP is not an official market price, can change rapidly, and should not be considered a guaranteed listing price.