Business Model and Revenue Forecast
Moneyview operates as a digital financial-services platform, with multiple sources of revenue. Fees and commission income represents approximately 56% of revenue, while interest income contributes approximately 40% of revenue.
Interest income has also grown significantly during the FY24–FY26 period, increasing from approximately ₹300.83 crore in FY24 to ₹1,312.70 crore in FY26. This represents a CAGR of approximately 108.9% during the period.
At the same time, the company’s overall revenue from operations has grown at a very high rate. Revenue growth was approximately 133% in FY24, 74% in FY25 and 43% in FY26. These figures represent the growth in total revenue, rather than the growth in interest income.
Given the company’s strong historical growth, maintaining the historical growth rate over the long term may be difficult. Therefore, the analysis adopts a 30% revenue growth assumption for FY27, followed by a 2 percentage-point annual tapering in the growth rate.
Accordingly, the revenue growth assumptions are: FY27E: 30%; FY28E: 28%; FY29E: 26%; FY30E: 24%; FY31E: 22%. This results in projected revenue increasing from approximately ₹4,356.51 crore in FY27E to ₹10,629.20 crore in FY31E.
Also read; Jindal Supreme IPO Valuation
Also read; NSE IPO Valuation analysis
Valuation Analysis
Key Assumptions
| Key Assumption | Base Case |
| Revenue Growth – FY27E | 30% |
| Annual Growth Tapering | 2 percentage points |
| Terminal Growth Rate | 2% |
| WACC | 9% |
The 30% FY27E revenue growth assumption reflects a moderation from the company’s historical growth rate, while the 2 percentage-point annual tapering reflects the expectation that growth will gradually normalize as the company becomes larger. A 2% terminal growth rate has been assumed for the terminal period. A 9% WACC has been used for the DCF calculation.
Financial Performance (₹ Crore)
| Particulars | FY22A | FY23A | FY24A | FY25A | FY26A |
| Revenue from Operations | 257.97 | 576.75 | 1,342.37 | 2,339.15 | 3,351.16 |
| % Growth | — | 124% | 133% | 74% | 43% |
| Gross Profit | 257.34 | 536.92 | 1,342.37 | 2,274.49 | 3,261.85 |
| Gross Margin | 99.8% | 93.1% | 100.0% | 97.2% | 97.3% |
| Operating Expenses | 225.37 | 447.27 | 1,060.54 | 1,615.89 | 2,139.40 |
| Operating Expenses / Revenue | 87% | 78% | 79% | 69% | 64% |
| Operating Profit | 31.97 | 89.65 | 281.83 | 658.60 | 1,122.45 |
| Operating Profit Margin | 12% | 16% | 21% | 28% | 33% |
| Depreciation | 1.32 | 4.25 | 4.86 | 8.95 | 9.88 |
| EBIT | 30.65 | 85.40 | 276.97 | 649.65 | 1,112.57 |
| EBIT Margin | 12% | 15% | 21% | 28% | 33% |
| Other Income | 0.06 | 100.28 | 46.87 | 39.38 | -153.53 |
| Finance Cost | 13.13 | 24.00 | 125.54 | 369.82 | 631.69 |
| Profit Before Tax | 17.58 | 161.68 | 198.30 | 319.21 | 327.35 |
| Tax | -0.15 | -0.88 | 27.16 | 78.94 | 84.65 |
| Net Profit | 17.73 | 162.56 | 171.14 | 240.27 | 242.70 |
Note: The ₹1,122.45 crore figure is presented as Operating Profit rather than EBITDA because that is what the calculation in the supplied model represents.
Revenue Projections
| Particulars | FY27E | FY28E | FY29E | FY30E | FY31E |
| Revenue Growth | 30% | 28% | 26% | 24% | 22% |
| Revenue (₹ Cr) | 4,356.51 | 5,576.33 | 7,026.18 | 8,712.46 | 10,629.20 |
Free Cash Flow Projections
| Particulars | FY27E | FY28E | FY29E | FY30E | FY31E |
| Revenue | 4,356.51 | 5,576.33 | 7,026.18 | 8,712.46 | 10,629.20 |
| EBITDA Margin | 28% | 28% | 28% | 28% | 28% |
| EBITDA | 1,219.82 | 1,561.37 | 1,967.33 | 2,439.49 | 2,976.18 |
| Less: Depreciation | 19.94 | 25.52 | 32.15 | 39.87 | 48.64 |
| EBIT | 1,199.89 | 1,535.85 | 1,935.18 | 2,399.62 | 2,927.54 |
| Less: Tax | 299.97 | 383.96 | 483.79 | 599.90 | 731.88 |
| NOPAT | 899.91 | 1,151.89 | 1,451.38 | 1,799.71 | 2,195.65 |
| Add: Depreciation | 19.94 | 25.52 | 32.15 | 39.87 | 48.64 |
| Less: Reinvestment | 449.96 | 575.95 | 725.69 | 899.86 | 1,097.83 |
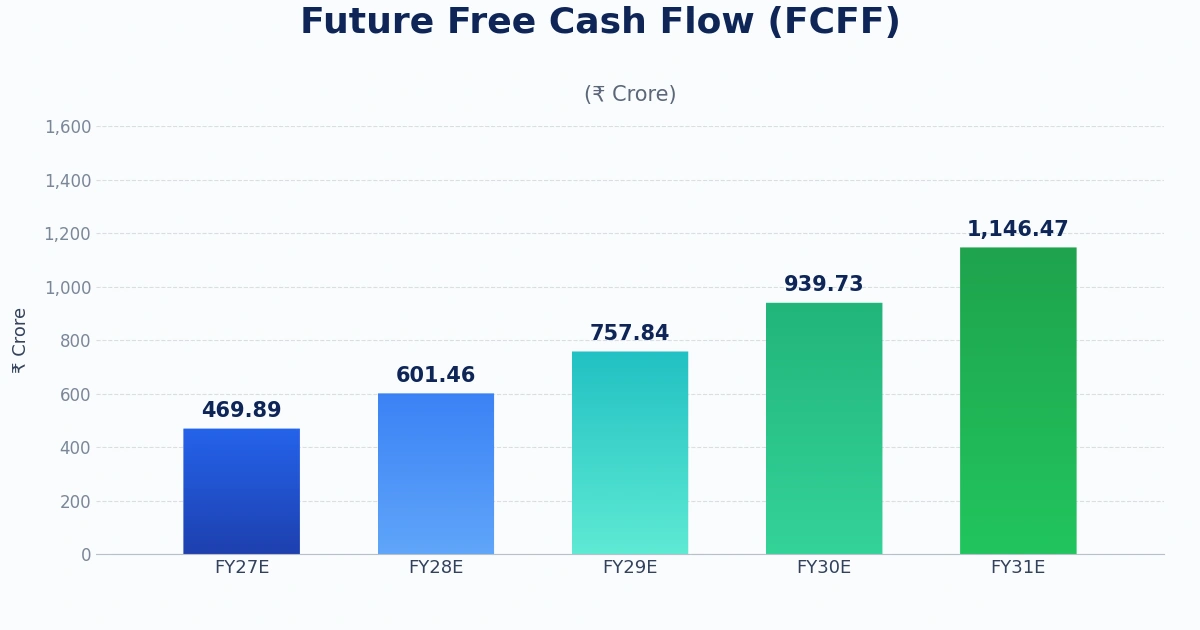
| FCFF | 469.89 | 601.46 | 757.84 | 939.73 | 1,146.47 |
The FCFF calculation follows: FCFF = NOPAT + Depreciation − Reinvestment. The resulting FCFF increases from approximately ₹469.89 crore in FY27E to ₹1,146.47 crore in FY31E.
DCF Valuation
Using a WACC of 9% and a terminal growth rate of 2% over the FY27E–FY31E forecast period, the model produces an estimated Enterprise Value of ₹13,790.91 crore.
Equity Value Calculation
| Particulars | ₹ Crore |
| Enterprise Value | 13,790.91 |
| Less: Debt | 5,185.06 |
| Add: Cash & Investments | 1,042.60 |
| Equity Value | 9,648.45 |
| Shares Outstanding (Cr) | 176.02 |
| DCF Fair Value per Share | ₹54.81 |
The IPO upper price band is ₹34 per share. Based on the model, the difference between the DCF value and the upper price band is approximately ₹20.81 per share, corresponding to approximately 61.22% relative to the ₹34 upper price band.
How Our Analysis Could Fail
There are several parameters that could materially affect this valuation. The first is the assumptions used in the DCF. We have assumed 30% revenue growth in FY27, followed by a 2 percentage-point annual tapering, a 2% terminal growth rate, and a 9% WACC. Any change in these assumptions would directly affect the estimated enterprise value.
The company has experienced strong historical growth, but maintaining such a high growth rate becomes increasingly challenging as the business expands. Revenue growth has already moderated from approximately 133% in FY24 to 74% in FY25 and 43% in FY26.
Therefore, even though we have assumed 30% growth for FY27, the company may not be able to sustain this level of growth over the longer term.
Another important factor is the company’s ability to manage credit quality, NPAs, liquidity and funding requirements. Changes in these factors could affect the company’s interest income, costs and ultimately its cash flows.
Regulatory developments are another potential source of uncertainty. Changes in the regulatory framework governing digital lending, data protection, capital requirements or other financial-services activities could affect the company’s operating model and growth trajectory.
As a result, the DCF valuation should be viewed as being dependent on the assumptions used in the model rather than as a fixed or certain value.
Scenario Analysis
| Scenario | FY27 | FY28 | FY29 | FY30 | FY31 | DCF Price |
| Base Case | 30% | 28% | 26% | 24% | 22% | ₹54.81 |
| Best Case | 35% | 33% | 31% | 29% | 27% | ₹70 |
| Worst Case | 25% | 23% | 21% | 19% | 17% | ₹41 |
The scenarios illustrate how changes in revenue growth assumptions can materially affect the DCF valuation.
Sensitivity Analysis
| Terminal Growth / WACC | 9.01% | 9.51% | 10.01% | 10.51% | 11.01% | 11.51% |
| 2% | 55 | 49 | 44 | 40 | 36 | 32 |
| 3% | 66 | 58 | 52 | 47 | 42 | 38 |
| 4% | 81 | 71 | 63 | 55 | 49 | 44 |
| 5% | 104 | 89 | 77 | 68 | 60 | 53 |
| 6% | 142 | 118 | 99 | 85 | 74 | 65 |
DCF Valuation Summary
| Metric | Value |
| Revenue Growth – FY27E | 30% |
| Annual Growth Tapering | 2 percentage points |
| Terminal Growth Rate | 2% |
| WACC | 9% |
| Enterprise Value | ₹13,790.91 Cr |
| Debt | ₹5,185.06 Cr |
| Cash & Investments | ₹1,042.60 Cr |
| Equity Value | ₹9,648.45 Cr |
| Post-Issue Shares | 176.02 Cr |
| DCF Fair Value | ₹54.81/share |
| IPO Upper Band | ₹34/share |
| Difference vs. Upper Band | ₹20.81/share |
| Calculated Upside | 61.22% |
| Best-Case DCF | ₹70 |
| Worst-Case DCF | ₹41 |
Frequently Asked Questions
1. What is Moneyview’s DCF fair value per share?
Based on the assumptions used in this DCF model, the estimated fair value is ₹54.81 per share. The calculation is based on an Enterprise Value of ₹13,790.91 crore, debt of ₹5,185.06 crore, cash and investments of ₹1,042.60 crore and 176.02 crore shares outstanding.
2. What revenue growth rate has been assumed for Moneyview?
The model assumes 30% revenue growth in FY27E, followed by a 2 percentage-point annual tapering: 28% in FY28E, 26% in FY29E, 24% in FY30E and 22% in FY31E.
3. What EBITDA margin is used in the DCF forecast?
The DCF forecast uses a 28% EBITDA margin for FY27E through FY31E. The historical ₹1,122.45 crore figure in the supplied income-statement calculation is treated as Operating Profit rather than EBITDA.
4. What are the best-case and worst-case DCF values?
Under the scenario assumptions in the model, the Best Case uses revenue growth of 35%, 33%, 31%, 29% and 27% and produces a DCF price of ₹70. The Worst Case uses 25%, 23%, 21%, 19% and 17% and produces a DCF price of ₹41.
5. What are the key assumptions that could affect the DCF valuation?
The key assumptions are revenue growth, annual growth tapering, EBITDA margin, reinvestment, WACC and terminal growth. Credit quality, liquidity, funding requirements and regulatory developments can also affect the company’s cash flows and therefore the valuation.